Описание
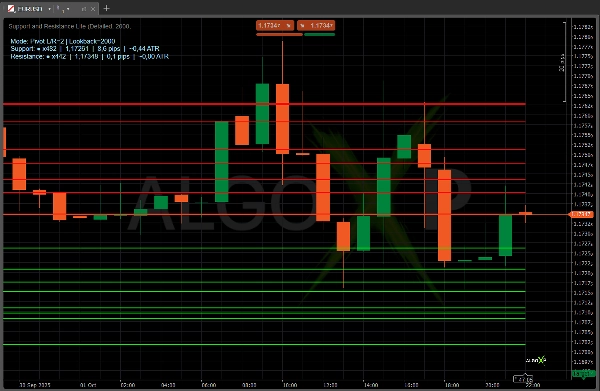
🎱Support and Resistance Lite — минималистичный индикатор поддержки/сопротивления, который строит реальные рыночные уровни на основе экстремумов (пивотов) максимумов/минимумов.
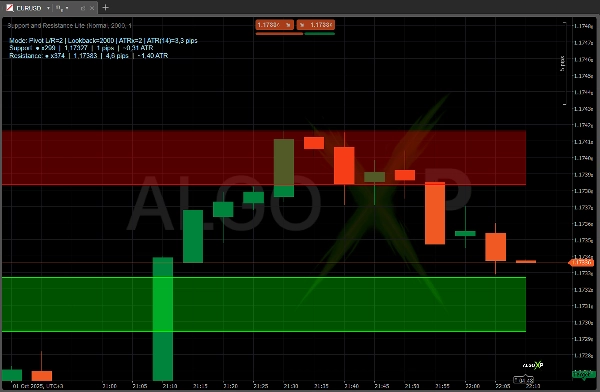
S/R на основе пивотов, который находит реальные уровни из пивотов, объединяет близкие экстремумы и сохраняет только самые сильные — показывая до N уровней с каждой стороны. Опциональные полосы ATR выделяют ближайшие уровни поддержки и сопротивления (только), а компактный HUD показывает режим и точное расстояние до ближайших уровней в пипсах и ~ATR.
🚀 Почему трейдеры выбирают его
- Уровни формируются из реальных ценовых колебаний, а не фиксированных формул.
- Чистый график: только лучшие уровни выше/ниже цены, без загромождения.
- Опциональные полосы только на ближайших уровнях поддержки и сопротивления (полупрозрачные, масштабируемые по ATR).
- Простые, практичные настройки: предустановка длины пивота, количество баров для анализа, лимит с каждой стороны, цвета, цвет HUD.
- Отсутствие мерцания в логике отрисовки; линии и зоны обновляются плавно.
⚡ Быстрые советы по предустановкам
- Скальпинг/Интрадей:
Normal, Lookback 600–1000, полосы ВКЛ, коэффициент ATR 1.0–1.3. - Чище/Медленнее:
Clean, Lookback 500–800. - Больше деталей:
Detailed, Lookback 800–1200.
✨ Хотите конфлюенс на старших таймфреймах, взвешивание касаний (затухание/истечение), ближайшие входные полосы, расстояние Bid/Ask, Pro метки (пипсы и ~ATR) и живые состояния (пробой/ретест/переключение/касание)? Обновитесь до Pro.
Найдите Pro версию здесь
Изучите больше ресурсов и подробный FAQ на AlgoXP
🟢 🎱 🔴 🎱 🟢 🎱 🔴 🎱 🟢 🎱 🔴 🎱 🟢 🎱 🔴
Сводка
Отзывы покупателей
5 | 0 % | |
4 | 100 % | |
3 | 0 % | |
2 | 0 % | |
1 | 0 % |