Описание
Это не ваш обычный индикатор Volume Delta. Это индикатор Level 2 DOM Volume Delta — институционального уровня поток ордеров для cTrader. Преимущество, за которое институции платят миллионы.
Проблема, с которой сталкивается каждый розничный трейдер. Свеча закрывается зелёной. Объём высокий. Вы покупаете.
Цена сразу разворачивается. Вас выбивает по стопу. График "солгал" вам.
Он не солгал — вы просто не могли видеть, что происходило внутри свечи. Та зелёная свеча с высоким объёмом? 70% этого объёма — агрессивные продажи. Закрытие поддерживалось тонким слоем ордеров на покупку в нижней части диапазона. Институции распределяли свои позиции против вашего ордера на покупку.
Стандартные индикаторы объёма показывают вам общий объём. Они никогда не показывают кто контролировал рынок.
Volume Delta меняет это. Что на самом деле показывает Volume Delta
Volume Delta разделяет объём каждой свечи на объём покупок и объём продаж, затем вычисляет разницу — дельту. Положительная дельта означает, что покупатели были более агрессивны. Отрицательная дельта означает доминирование продавцов.
Это самая важная информация, которая отличает профессиональных трейдеров от розничных: не сколько было совершено сделок, а какая сторона торговала более агрессивно. Это убеждённость. Дельта — это отпечаток намерений за каждой ценовой свечой.
Но на этом всё не заканчивается
Этот индикатор не угадывает. В проприетарном сочетании данных он читает данные глубины рынка Level 2 — фактическую книгу ордеров, стоящую за ценой, которую вы видите на экране.
Данные Level 2 (также известные как DOM — глубина рынка) показывают реальные ордера на покупку и продажу, сгруппированные на каждом ценовом уровне. Не последнюю сделку. Не оценку. Реальную ликвидность, находящуюся в ожидании от банков, хедж-фондов и институциональных отделов, проходящую через поставщиков ликвидности вашего брокера.
Результат — уровень точности 85-95% в классификации объёма покупок и продаж — далеко превосходящий любые формульные приближения.
Почему это важно — что видят институции, а вы нет
Goldman Sachs, Citadel, Jump Trading — все они торгуют с данными потока ордеров. Они видят давление покупателей и продавцов в реальном времени. Они видят поглощение. Они видят, когда уровень защищается. Они видят, когда дельта расходится с ценой.
Они платят миллионы за эту инфраструктуру. Потоки данных, колокированные серверы, проприетарные инструменты.
Этот индикатор приносит ту же основную концепцию на ваш график cTrader. Не упрощённую версию. Фактические данные Level 2 DOM из пула ликвидности вашего брокера, обработанные в ту же классификацию покупок и продаж, которую используют профессиональные трейдеры потока ордеров.
Разница между розничным трейдером и институциональным не в интеллекте. В информации. Volume Delta сокращает этот разрыв.
Для кого это
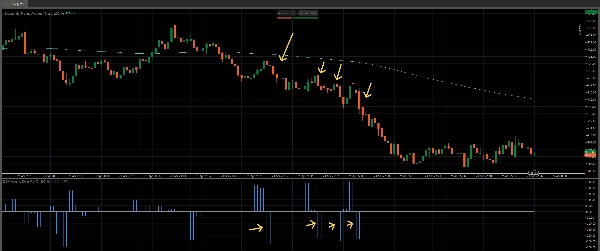
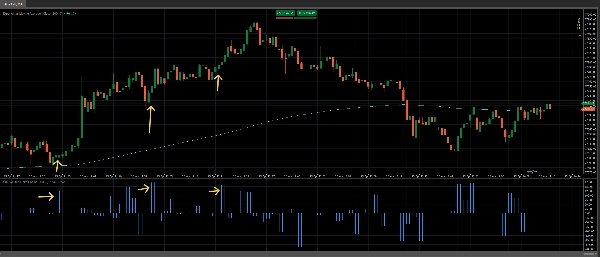
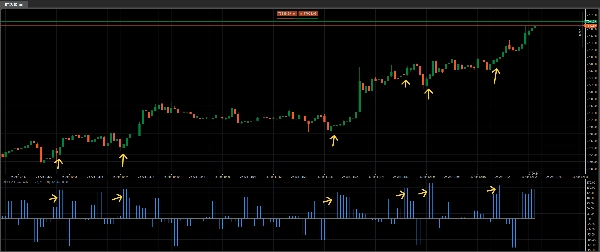
Дейтрейдеры, которые хотят видеть сквозь шум. Когда свеча выглядит бычьей, но дельта отрицательная, вы знаете, что нужно подождать. Когда свеча выглядит слабой, но дельта сильно положительная, вы понимаете, что институции накапливаются. Дельта не лжёт — она показывает, что произошло, а не как это выглядело.
Скальперы, которым нужно знать, какая сторона контролирует рынок прямо сейчас. Всплеск дельты при пробое подтверждает его реальность. Пробой с плоской дельтой предупреждает о ловушке ещё до начала разворота.
Свинг-трейдеры, которые хотят подтверждения. Дивергенции дельты — когда цена делает новый минимум, а дельта растёт — одни из самых надёжных сигналов разворота в профессиональной торговле. Этот индикатор обнаруживает их автоматически.
Все, кто торгует на форекс, индексах или товарах в cTrader с брокером, предоставляющим данные Level 2. Fusion Markets, IC Markets, Go Markets и подобные ECN/STP брокеры все предоставляют данные DOM, которые читает этот индикатор.
Если вы когда-либо оказывались не на той стороне "свечи с высоким объёмом", это инструмент, который объяснит почему.
Что вы получаете
Чистый, профессиональный гистограмм под вашим графиком, показывающий чистую дельту для каждой свечи, основанный на высокоточных данных. Положительные бары означают доминирование покупателей. Отрицательные бары — доминирование продавцов. Размер бара показывает насколько одна сторона перевешивала другую. Использование вместе с индикаторами, такими как 200 ema, даёт подтверждение и высоковероятные сигналы.
Никакого мусора. Никаких запаздывающих скользящих средних объёма. Никаких цветных свечей, которые "оценивают" покупки и продажи. Только сырая, нефильтрованная разница между агрессивными покупками и агрессивными продажами — вычисленная из самого глубокого источника данных, доступного розничным трейдерам.
Этот индикатор также предоставляет опцию использования фильтра объёма, чтобы показывать только самые важные бары. Агрегировать бары объёма при желании.
Один взгляд на бар дельты расскажет вам то, что пытаются приблизить десять других индикаторов. Получите свой сейчас для cTrader. Это очевидный выбор за такую низкую цену.
Сочетайте это с нашим индикатором Volume Profile Pro для ещё более информированных решений на ключевых уровнях: https://ctrader.com/products/4079
Посмотрите наш удивительный Black Box Bot здесь: https://ctrader.com/products/3241
Сводка
The indicator displays a clean histogram below the chart representing net volume delta per bar: positive bars indicate buyer dominance, negative bars indicate seller dominance, and bar size reflects the strength of that dominance. This provides traders with insight into market intent beyond total volume, revealing whether buyers or sellers controlled the price action.
It supports forex, indices, and commodities trading with brokers offering Level 2 data, such as Fusion Markets and IC Markets. Features include volume filtering and aggregated volume bars. The tool is suited for day traders, scalpers, and swing traders seeking to interpret order flow, confirm breakouts, detect divergences, and enhance decision-making with professional-level order flow data.
Отзывы покупателей
5 | 50 % | |
4 | 50 % | |
3 | 0 % | |
2 | 0 % | |
1 | 0 % |