
ADXMultiframeIndicator
Индикатор
1 покупки
Версия 1.0, Oct 2025
Windows, Mac
5.0
Отзывы: 2
Описание
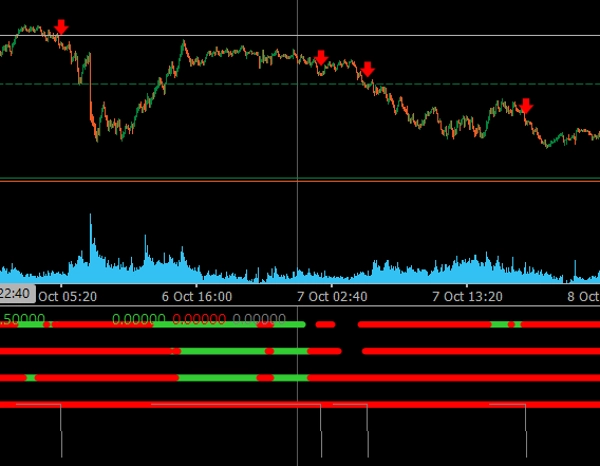
Многофреймовые точки и стрелки тренда ADX Multi-Timeframe ADX Trend Dots & Arrows — профессиональный торговый индикатор для cTrader, предназначенный для выявления согласованных рыночных трендов на нескольких таймфреймах с использованием Average Directional Movement Index (ADX).
🔹 Ключевые особенности:
- ✅ Анализ до 4 настраиваемых таймфреймов (M15, H1, H4, Daily).
- ✅ Цветные точки показывают направленную тенденцию (Зеленый = Восходящий тренд, Красный = Нисходящий тренд).
- ✅ Автоматические стрелки появляются, когда все таймфреймы совпадают по направлению.
- ✅ Фильтр последовательных баров снижает количество ложных или преждевременных сигналов.
- ✅ Чистая, современная визуализация, оптимизированная для темных и светлых тем графиков.
- ✅ Идеально подходит для выявления подтверждений на нескольких таймфреймах и точек продолжения тренда.
Этот индикатор идеально подходит трейдерам, которые хотят видеть общую картину и входить в сделку только когда все таймфреймы согласованы, обеспечивая более сильные и надежные торговые сигналы.
Сводка
ИИ-сводка
The ADXMultiframeIndicator is a trading indicator for the cTrader platform that identifies market trends by analyzing the Average Directional Movement Index (ADX) across multiple timeframes. It supports up to four customizable timeframes, including M15, H1, H4, and Daily. The indicator displays colored dots to indicate directional bias—green for uptrends and red for downtrends—and automatically shows arrows when all selected timeframes align in the same direction. A consecutive bars filter is included to reduce false or premature signals. The visualization is designed to be clear and modern, compatible with both dark and light chart themes. This tool assists traders in confirming multi-timeframe trends and identifying trend continuation points by highlighting when all timeframes agree, facilitating more informed trade entries. It is particularly useful for analyzing indices markets.
Профиль индикатора
Отзывы покупателей
5.0
Отзывы: 2
5 | 100 % | |
4 | 0 % | |
3 | 0 % | |
2 | 0 % | |
1 | 0 % |
Отзывы покупателей
October 28, 2025
the first signal should not decide the only input, but it can look better than it is during a lucky run.
Обсуждение
Частые вопросы
Indices
Продукты, доступные в cTrader Store, включая торговых ботов, индикаторы и плагины, предоставляются сторонними разработчиками и доступны исключительно в информационных и технических целях. cTrader Store не является брокером и не предоставляет инвестиционные консультации, персональные рекомендации или какие-либо гарантии будущей доходности.
Больше от этого автора


![Логотип продукта "High-Low Divergence [Iridio Capital]"](https://cdn.ctrader.com/image/webp/443c4661-7abb-40f1-842f-4b6ec560649b_40914)


Цена
С 21/01/2025
3
Продажи