
Stochastic Momentum Index
Indicador
1 compras
Versión 2.1, Jan 2026
Windows, Mac
4.5
Valoraciones: 2
Desde 31/01/2025
415.05M
Volumen operado
2.69M
Pips ganados
4
Ventas
187
Instalaciones gratis
Descripción
Índice de Momentum Estocástico (SMI) es un oscilador estocástico refinado diseñado para medir el momentum de manera más suave que un Estocástico clásico. Esta implementación en cTrader coincide con la formulación comúnmente usada en TradingView aplicando suavizado doble EMA tanto al rango relativo como al rango alto-bajo, produciendo una curva de momentum limpia y estable que funciona bien en condiciones de tendencia y de rango.
Qué muestra
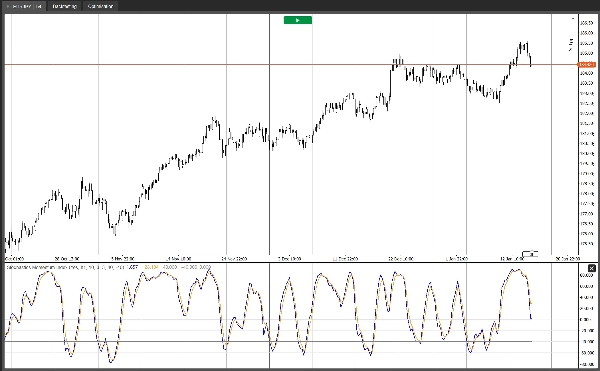
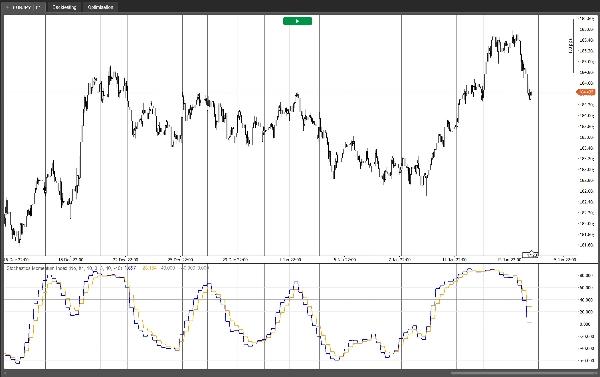
- El SMI mide dónde se sitúa el cierre en relación con el punto medio del rango alto-bajo reciente, normalizado y escalado.
- Los valores tienden a oscilar entre -100 y +100.
- Los niveles de referencia de sobrecompra/sobreventa (por defecto +40 / -40) ayudan a identificar condiciones estiradas y extremos de momentum.
Gráficos
- SMI: la línea principal de momentum.
- EMA basada en SMI: una línea de señal (EMA del SMI) para cruces y confirmaciones.
- Niveles de Sobrecompra / Sobreventa / Medio (0) para un contexto visual rápido.
Cómo lo usan los traders
- Regímenes de tendencia: Usa la línea 0 como filtro direccional (por encima de 0 = presión alcista, por debajo de 0 = presión bajista) y opera retrocesos mediante cruces del SMI contra la línea de señal en la dirección de la tendencia.
- Regímenes de reversión a la media: Opera en contra de los extremos cuando el SMI regresa desde sobrecompra/sobreventa y confirma con un cruce, apuntando a menudo a la línea 0 como primer objetivo de reversión a la media.
- Divergencias: La divergencia de momentum entre el precio y el SMI puede destacar posibles debilitamientos en los movimientos.
Opción multitemporal
- Selecciona un Marco Temporal de Origen para calcular el SMI desde un marco temporal superior mientras se muestra en el gráfico actual (ideal para filtrar ruido y mejorar la calidad de la señal).
- O activa Usar Marco Temporal del Gráfico para mantener los cálculos en el marco temporal actual.
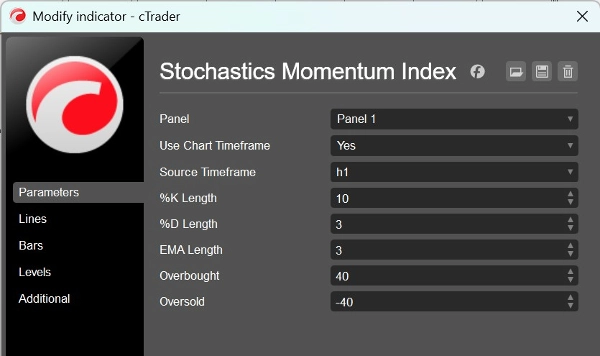
Entradas
- Longitud %K: ventana de retroceso para el máximo alto / mínimo bajo.
- Longitud %D: longitud de suavizado usada en el cálculo de doble EMA.
- Longitud EMA: longitud de la línea de señal (EMA del SMI).
- Sobrecompra / Sobreventa: niveles de referencia.
- Usar Marco Temporal del Gráfico / Marco Temporal de Origen: cálculo opcional en marco temporal superior.
Este indicador está diseñado para ser ligero, estable y práctico para flujos de trabajo de trading reales, ya sea que operes continuación de tendencia, rangos o uses el SMI como filtro de confirmación dentro de una estrategia más amplia.
Resumen
Resumen de IA
The Stochastic Momentum Index (SMI) indicator for cTrader is a refined momentum oscillator that applies double EMA smoothing to both the relative range and high–low range, producing a smooth and stable momentum curve. It measures the position of the close price relative to the midpoint of the recent high–low range, with values oscillating between -100 and +100. Default overbought and oversold levels are set at +40 and -40, respectively, to highlight momentum extremes.
The indicator plots three key elements: the main SMI momentum line, an EMA-based signal line for crossovers and confirmation, and reference levels for overbought, oversold, and the zero midpoint. Traders use the zero line as a directional filter to identify bullish or bearish pressure and trade pullbacks via SMI and signal line crossovers. It also supports mean-reversion strategies by signaling fades from overbought/oversold conditions and can highlight momentum divergences.
A multi-timeframe option allows calculation of the SMI from a higher timeframe while displaying it on the current chart, helping to filter noise and improve signal quality. User inputs include lookback lengths for %K and %D, signal line EMA length, overbought/oversold levels, and timeframe selection. The indicator is designed for use across various markets including Forex, stocks, commodities, indices, and cryptocurrencies.
Perfil del indicador
Valoraciones de clientes
4.5
Valoraciones: 2
5 | 50 % | |
4 | 50 % | |
3 | 0 % | |
2 | 0 % | |
1 | 0 % |
Valoraciones de clientes
January 28, 2026
The part worth keeping is the workflow feels calmer, and 2 swing checks is the line to watch.
January 23, 2026
it earns a spot because weak entries have a harder time slipping through, and spread and slippage need a line in the notes.
Conversación
Preguntas frecuentes
BTCUSD
Forex
Signal
Breakout
Indices
EURUSD
Commodities
GBPUSD
NZDUSD
Prop
Scalping
Crypto
Stocks
XAUUSD
NAS100
USDJPY
Los productos disponibles a través de cTrader Store, incluidos bots, indicadores y plugins para operar, son proporcionados por desarrolladores de terceros y están disponibles únicamente con fines informativos y de acceso técnico. cTrader Store no es un bróker, por lo que no proporciona asesoramiento de inversión, recomendaciones personales ni ninguna garantía de rentabilidad futura.
Más de este autor


Precio
Desde 31/01/2025
415.05M
Volumen operado
2.69M
Pips ganados
4
Ventas
187
Instalaciones gratis