
LT Flexible Volume Profile
Chỉ báo
12 lượt mua
Phiên bản 1.0, Sep 2024
Windows, Mac
5.0
Đánh giá: 3
Mô tả
Lưu ý: Đã thử nghiệm chỉ trên cTrader Windows.
Hồ sơ Khối lượng
Một biểu đồ hồ sơ dọc trên biểu đồ giá để hiển thị tại mức giá nào có nhiều/ít khối lượng (mức độ quan tâm giao dịch).
Chỉ báo Hồ sơ Khối lượng Linh hoạt
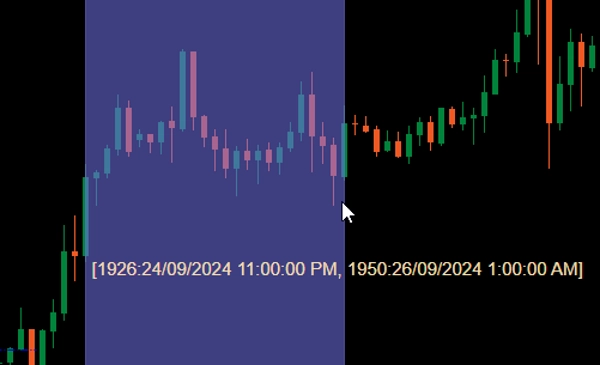
Khi thêm vào biểu đồ của bạn, giữ Ctrl và kéo chuột trái trên một khu vực trong biểu đồ giá để vẽ hồ sơ cho khu vực đó.
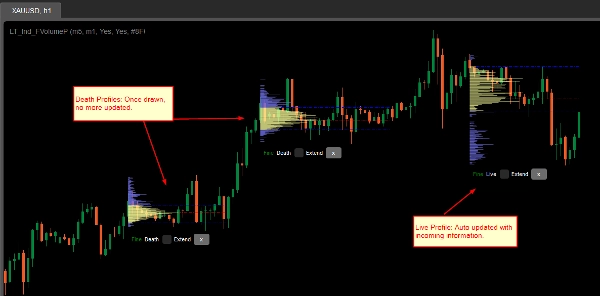
Vì hiệu suất, hồ sơ sẽ được vẽ ở 2 trạng thái:
- Hồ sơ thô: Chỉ báo sẽ sử dụng khung thời gian được định nghĩa bởi CoarseTF (mặc định m5) để tải thông tin khối lượng, điều này thường nhanh. Trong khi hồ sơ thô được hiển thị, hồ sơ tinh sẽ được tải ngầm.
- Hồ sơ tinh: Hồ sơ chính xác hơn, sử dụng khung thời gian được định nghĩa bởi FineTF (mặc định m1), nhưng bạn có thể đặt nó thành tinh nhất (t1 - một tick đơn). Tuy nhiên, nếu bạn đang xem biểu đồ khung thời gian Hàng ngày hoặc dài hơn, việc đặt khung thời gian thành tick sẽ làm tăng thời gian tải.
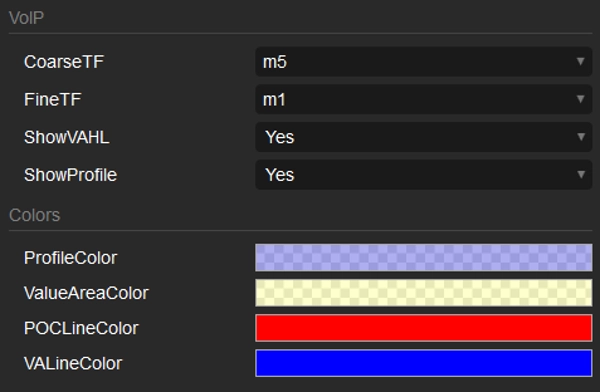
Các tham số
- CoarseTF: Khung thời gian cho dữ liệu thô (mặc định m5).
- FineTF: Khung thời gian cho dữ liệu tinh (mặc định m1).
- ShowVAHL: Hiển thị VAH (Giá trị Khu vực Cao) và VAL (Giá trị Khu vực Thấp).
- ShowProfile: Nếu chọn Có thì hiển thị toàn bộ hồ sơ, nếu không chỉ hiển thị VAH, VAL và POC (Điểm Kiểm soát).
- Colors: Tùy chỉnh màu sắc.
Cách sử dụng
Sau khi thêm chỉ báo vào biểu đồ giá của bạn, sử dụng Ctrl kéo chuột trái để chọn vùng trên biểu đồ mà bạn muốn tạo hồ sơ và chỉ vậy thôi.
Sau khi hồ sơ được hiển thị, bạn sẽ thấy một số thông tin/tùy chỉnh ở dưới cùng của hồ sơ:
- Thô/Tinh: trạng thái của hồ sơ.
- Chết/Sống: nếu hồ sơ của bạn bao phủ thanh (nến) mới nhất, thì đó là hồ sơ Sống và tự động cập nhật với thông tin mới.
- Ô kiểm mở rộng: đánh dấu để các đường VAH, VAL và POC kéo dài đến thanh (nến) mới nhất
- Nút x: Nhấn để xóa hồ sơ khỏi biểu đồ.
Tóm tắt
Tóm tắt AI
LT Flexible Volume Profile is a volume profile indicator designed for use on price charts, primarily tested on cTrader Windows. It visually represents trading volume distribution across price levels within a selected chart area, highlighting where trading interest is higher or lower.
Users activate the profile by holding Ctrl and dragging the mouse over a desired chart region. The indicator operates in two modes for performance optimization: a Coarse profile using a configurable timeframe (default 5 minutes) for faster loading, and a Fine profile using a finer timeframe (default 1 minute, with an option down to single ticks) for more precise volume data.
Key parameters include:
- CoarseTF and FineTF: timeframes for coarse and fine volume data aggregation.
- ShowVAHL: toggles display of Value Area High (VAH) and Value Area Low (VAL).
- ShowProfile: controls whether the full profile or only key levels (VAH, VAL, Point of Control) are shown.
- Colors: customizable color settings.
After rendering, the profile provides status indicators (Coarse/Fine, Live/Dead), options to extend VAH, VAL, and POC lines to the latest bar, and the ability to remove the profile. This tool supports detailed volume analysis to assist traders in identifying significant price levels based on traded volume.
Hồ sơ chỉ báo
Đánh giá của khách hàng
5.0
Đánh giá: 3
5 | 100 % | |
4 | 0 % | |
3 | 0 % | |
2 | 0 % | |
1 | 0 % |
Đánh giá của khách hàng
October 1, 2024
Sensible product to test around volume based context. The useful part is checking participation, value areas and pressure, with the numbers checked before scaling. I would review 20 reactions near POC or VWAP before trusting the read. The data helps most when price action confirms the same zone.
September 30, 2024
September 30, 2024
Good tool for patience if the trader wants it adds useful information behind the price move. It works best as support, not a final decision maker. Volume context is stronger when POC, VWAP and value area agree across 2 sessions. volume alone can be noisy without price action.
Thảo luận
Câu hỏi thường gặp
Forex
Các sản phẩm có sẵn trên cTrader Store, bao gồm bot giao dịch, chỉ báo và plugin, được cung cấp bởi các nhà phát triển bên thứ ba và chỉ nhằm mục đích cung cấp thông tin và tiếp cận kỹ thuật. cTrader Store không phải là nhà môi giới và không cung cấp lời khuyên đầu tư, khuyến nghị cá nhân hay bất kỳ đảm bảo nào về hiệu suất trong tương lai.


Giá
Kể từ 25/09/2024
34
Lượt bán