Описание
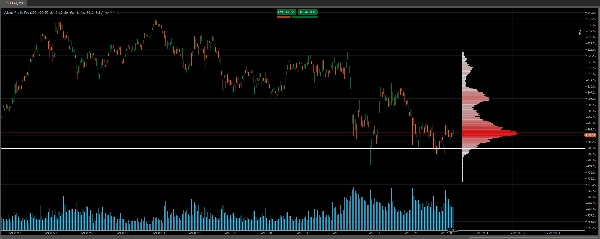
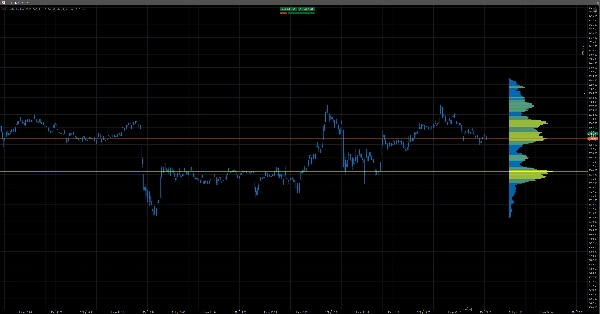
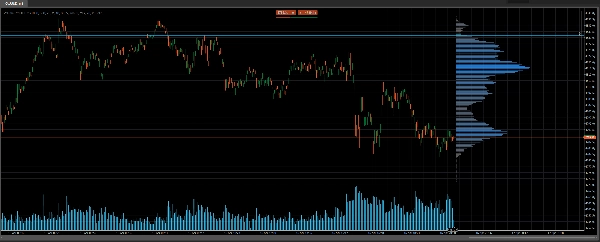
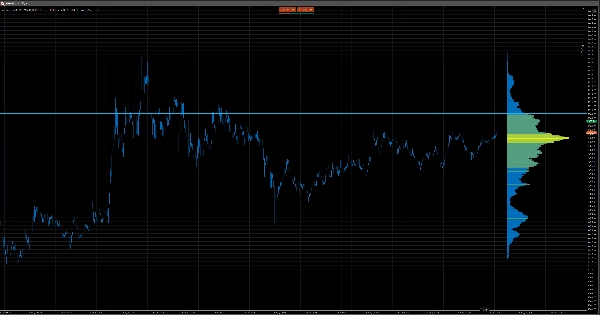
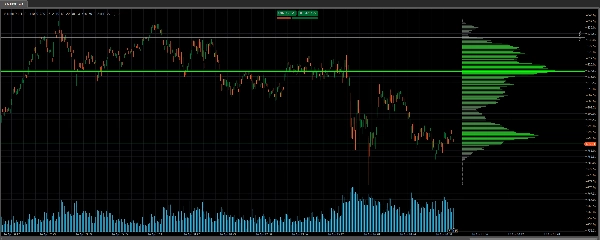
Новый Volume Profile Pro v2 — это высоконастраиваемый и легкий индикатор бокового и диапазонного объемного профиля для cTrader, где вы можете настроить множество параметров по своему усмотрению, включая Точку Контроля (POC), Верхнюю Границу Области Значения (VAH) и Нижнюю Границу Области Значения (VAL)
Что он делает
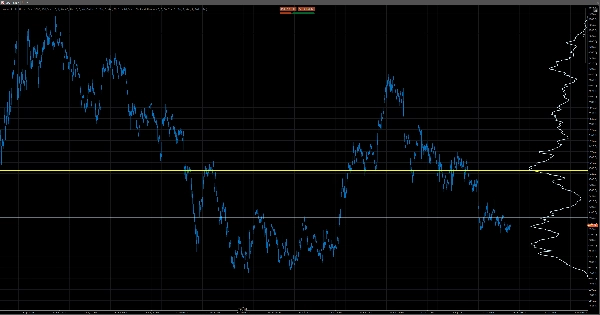
Volume Profile Pro строит горизонтальную динамическую гистограмму непосредственно справа от вашего графика cTrader, показывая, какой объем был торгован на каждом ценовом уровне за настраиваемый период просмотра. Вместо измерения объема во времени, он измеряет объем по цене — мгновенно показывая, где на рынке было совершено наибольшее количество сделок. Исходя из этого, он автоматически рассчитывает и отображает три ключевых уровня: Точку Контроля (POC), цену с наибольшим объемом торгов; а также Верхнюю Границу Области Значения (VAH) и Нижнюю Границу Области Значения (VAL) — границы ценового диапазона, содержащего 70% от всего объема торгов (настраиваемо).
Как это работает
Индикатор сканирует заданное пользователем количество исторических баров, находит ценовой диапазон от максимума до минимума и делит его на равномерно распределённые ценовые ряды. Объем тиков каждого бара затем распределяется по всем ценовым рядам, которые он охватывает. В результате получается гистограмма объема по цене с настраиваемой шириной столбцов, пропорциональной объему, и градиентной цветовой схемой, переходящей от рядов с низким объемом к рядам с высоким объемом. Он работает полностью на стандартных данных OHLCV на уровне баров — без тикового потока, без DOM, без внешних источников данных — и пересчитывается только на последнем баре, что обеспечивает быстроту, легкость и ненавязчивость.
Высокая настраиваемость
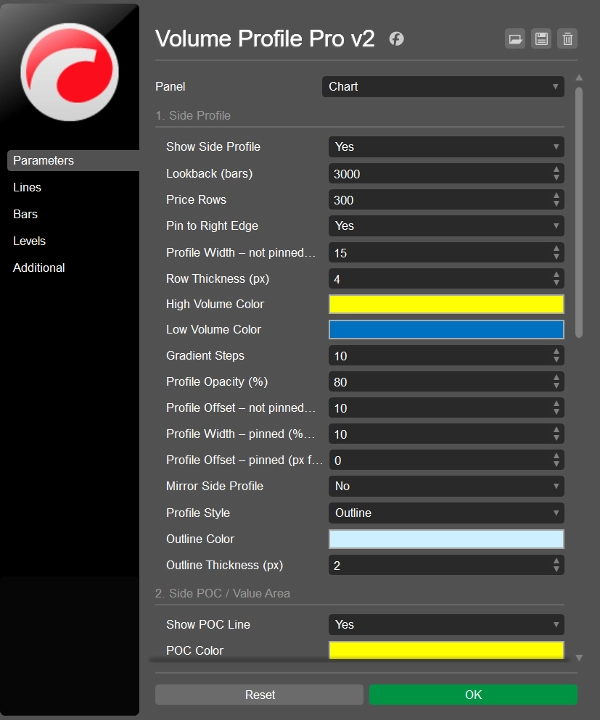
В Volume Profile Pro v2 практически каждый визуальный и аналитический элемент можно настроить:
- Период просмотра бокового профиля
- Количество ценовых рядов и толщина рядов
- Ширина профиля
- Прозрачность
- Градиентная цветовая схема
- Вы можете перевернуть боковой профиль
- Вы можете закрепить боковой профиль справа от графика
- Вы можете отображать боковой профиль в виде одной линии вместо столбцов
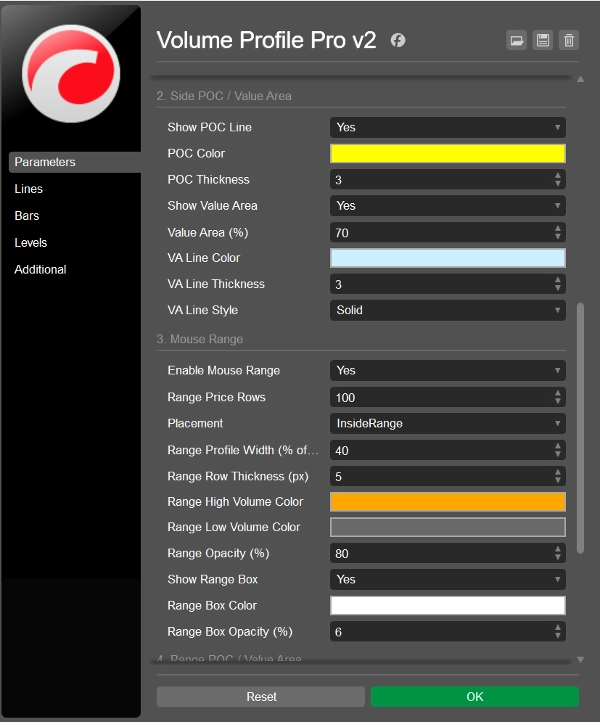
- Цвет и толщина POC
- Пороговое значение процента Области Значения
- Стиль линии Области Значения.
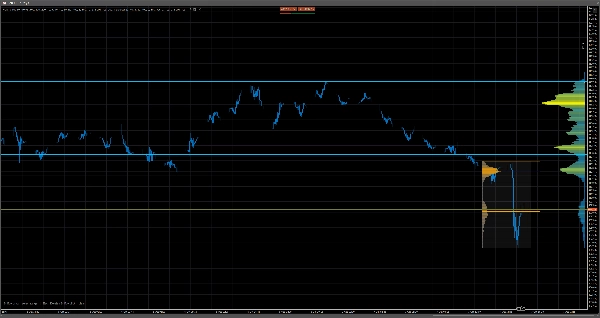
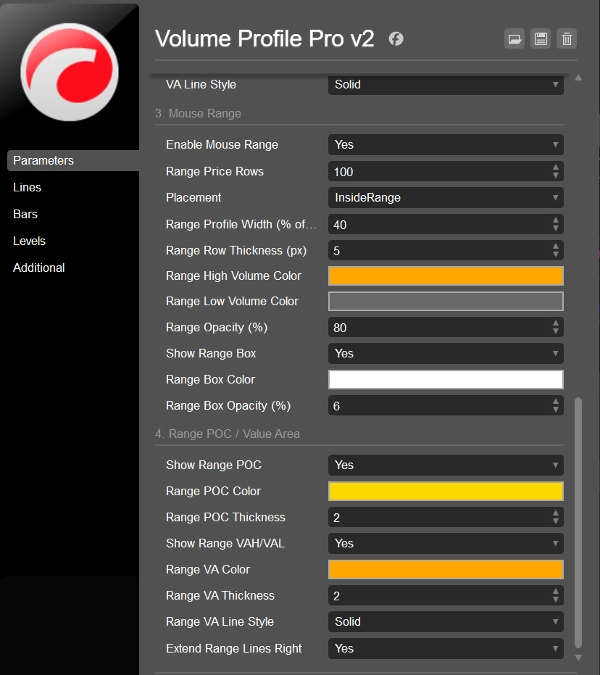
- Кроме того, теперь вы можете отображать профиль диапазона в выбранном диапазоне. Просто выберите прицел, перетащите прицел + удерживайте Shift, чтобы выбрать диапазон, и дважды нажмите кнопку Esc, чтобы убрать профиль диапазона.
Это делает его одинаково удобным как в качестве ненавязчивого фонового слоя для справки, так и в качестве яркого самостоятельного аналитического инструмента.
Для кого это
- Трейдеры, которым нужен комбинированный боковой и диапазонный объемный профиль, который при этом легкий
- Трейдеры, которым нужен чистый визуально объемный профиль, где можно даже отображать профиль объема в виде сплошной линии
- Трейдеры, которые хотят самостоятельно задавать период просмотра на графике
- Трейдеры, которые хотят иметь возможность настраивать множество цветов и прозрачность
- Трейдеры, которые хотят регулировать ширину и расположение на графике или закреплять профиль сбоку
- Трейдеры, которые хотят задавать количество ценовых рядов (рекомендуется держать это значение ниже 400)
- Трейдеры, которые хотят включать или отключать линии Точки Контроля (POC), Верхней и Нижней Границ Области Значения (VAH и VAL) и настраивать их внешний вид
Сочетайте это с нашим индикатором Level 2 DOM Volume Delta Pro для еще более информированных решений на ключевых уровнях: https://ctrader.com/products/4138
Посмотрите наш удивительный Black Box Bot здесь: https://ctrader.com/products/3241
Сводка
The tool analyzes historical bar data by dividing the high-to-low price range into evenly spaced rows and distributing each bar’s tick volume across these rows. This creates a volume-at-price histogram with adjustable bar widths proportional to volume and a gradient color scheme indicating volume intensity. It operates solely on standard OHLCV bar data without requiring tick feeds or external sources, recalculating only on the latest bar to maintain performance.
Users can extensively customize visual and analytical settings, including lookback period, number of price rows, profile width, opacity, colors, and the appearance and visibility of POC, VAH, and VAL lines. This flexibility allows the indicator to serve as either a subtle background reference or a prominent analytical tool. It supports analysis of key market structure concepts such as supply and demand, support and resistance, and liquidity zones.
Отзывы покупателей
5 | 33 % | |
4 | 67 % | |
3 | 0 % | |
2 | 0 % | |
1 | 0 % |