คำอธิบาย
Sessions by [BeyondTrading] — รู้ว่าตลาดเคยอยู่ที่ไหน
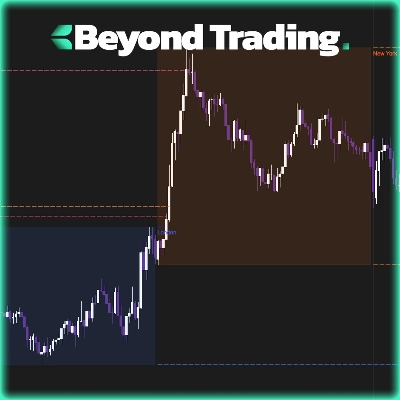
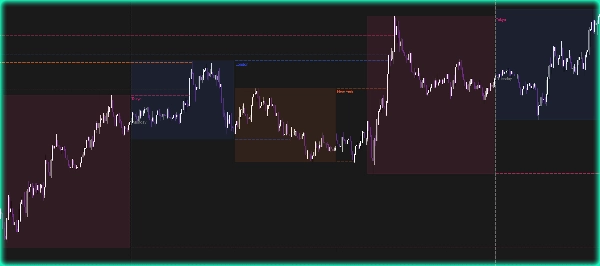
แสดงภาพเซสชันการซื้อขายหลัก 4 เซสชันโดยตรงบนแผนภูมิของคุณ — นิวยอร์ก, ลอนดอน, โตเกียว, ซิดนีย์ — ปรับแต่งได้เต็มที่ในเรื่องสี เวลา และความโปร่งใส แต่ละเซสชันจะวาดกล่องช่วงราคาแบบสดที่ขยายตัวแบบเรียลไทม์ตามการเคลื่อนไหวของราคา ดังนั้นคุณจึงรู้เสมอว่าช่วงราคาที่กำลังสร้างอยู่เป็นอย่างไร
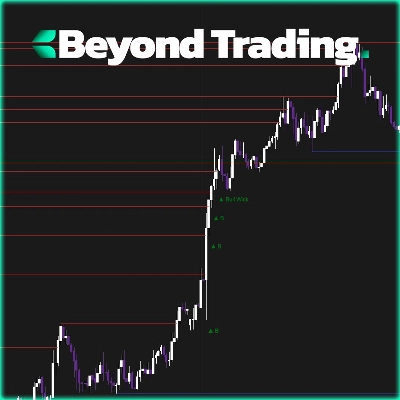
เมื่อเซสชันปิด ราคาสูงสุดและต่ำสุดจะถูกฉายไปข้างหน้าโดยอัตโนมัติเป็นเส้นประ ระดับเหล่านี้จะยังคงใช้งานได้จนกว่าราคาจะทะลุผ่าน — จากนั้นจะหยุด ไม่มีความยุ่งเหยิง ไม่มีการเดา คุณจะเห็นอย่างชัดเจนว่าระดับใดยังใช้งานอยู่และระดับใดถูกทำลายไปแล้ว
ทำไมระดับสูง/ต่ำของเซสชันจึงสำคัญ
ราคาสูงและต่ำของเซสชันเป็นแหล่งสภาพคล่องหลัก สถาบันและผู้สร้างตลาดมักจะกลับมาที่ระดับเหล่านี้เพื่อกลับตัวหรือเก็บสภาพคล่องก่อนการเคลื่อนไหวที่แท้จริง ราคาสูงสุดของลอนดอนก่อนหน้านี้ไม่ใช่แค่เส้น — แต่มันคือที่ที่คำสั่งหยุดอยู่ ที่ที่เทรดเดอร์เบรกเอาต์ติดกับดัก และที่ที่เงินฉลาดเข้ามาล่าก่อนจะกลับตัว ด้วยการขยายอัตโนมัติและการตรวจจับเบรกเอาต์ทันที คุณจะรู้เสมอว่าระดับใดยังอยู่ในเกมและมีแนวโน้มที่จะกระตุ้นปฏิกิริยา
คุณสมบัติ
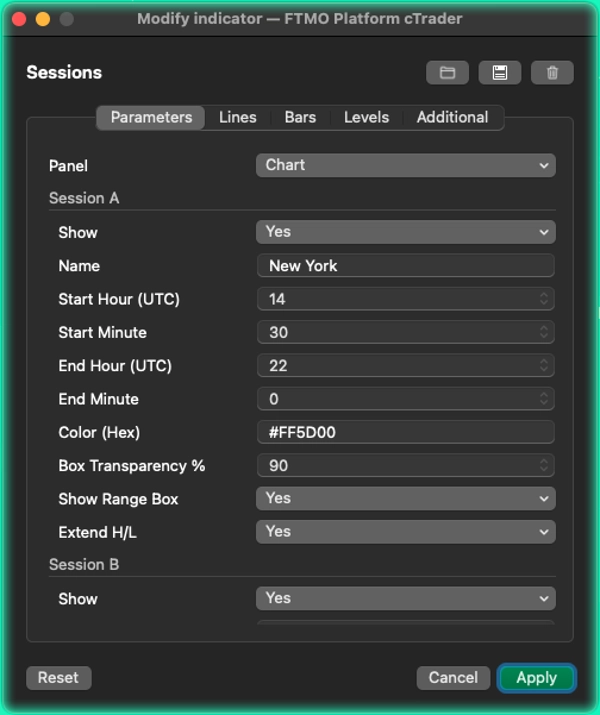
- 4 เซสชันที่ปรับแต่งได้เต็มที่พร้อมเวลเริ่ม/สิ้นสุดแบบกำหนดเอง สีแบบเลขฐานสิบหก และความโปร่งใส
- กล่องช่วงราคาแบบสดที่อัปเดตในทุกแท่ง
- ราคาสูงและต่ำฉายไปข้างหน้าหลังเซสชันปิด และถูกลบโดยอัตโนมัติเมื่อเบรกเอาต์เกิดขึ้น
- กำหนดจำนวนระดับสูงสุดที่ใช้งานได้เพื่อให้แผนภูมิสะอาด
- เส้นแบ่งแนวตั้งรายวันพร้อมป้ายวันในสัปดาห์
- ทำงานร่วมกับเซสชันข้ามคืนเช่นซิดนีย์
สรุป
After a session closes, the session's High and Low levels are automatically projected forward as dashed lines. These levels remain active until the price breaks through them, at which point they are removed, helping traders identify live breakout points without clutter. The indicator supports configurable maximum active levels to maintain chart clarity and includes a daily vertical divider labeled with the day of the week.
Designed to work with overnight sessions like Sydney, this tool highlights key liquidity zones where institutional traders often act. It is applicable across multiple markets including Forex, indices, commodities, cryptocurrencies, and stocks. The indicator aids in recognizing important breakout and reversal levels based on session highs and lows, facilitating informed trading decisions.
การสนทนา
รีวิวจากลูกค้า
5 | 100 % | |
4 | 0 % | |
3 | 0 % | |
2 | 0 % | |
1 | 0 % |