
คำอธิบาย
Trading Sessions Suite — โดย [BeyondTrading]
เทรดเดอร์ส่วนใหญ่ดูราคาหุ้น เทรดเดอร์ที่ดีที่สุดดู ตำแหน่ง ของราคาที่สัมพันธ์กับช่วงเวลาการซื้อขายที่สร้างมันขึ้นมา Trading Sessions Suite ให้บริบทนั้นกับคุณทันที — ไม่ต้องเปลี่ยนเครื่องมือ ไม่ต้องคำนวณในใจ ไม่ต้องเฝ้าดูนาฬิกา
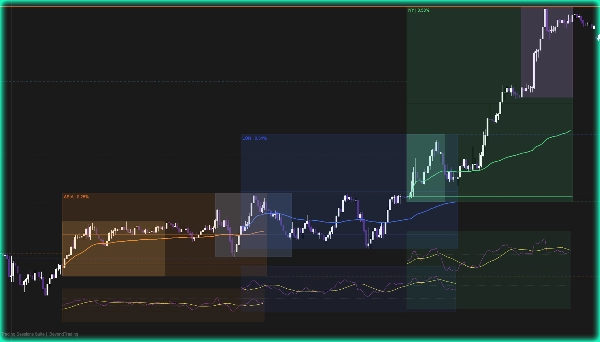
ในทันทีที่ช่วงเวลาการซื้อขายเปิด กล่องของมันจะเริ่มก่อรูป คุณจะเห็นช่วงราคากำลังก่อตัวแบบเรียลไทม์ จุดเปิดช่วงเวลาถูกทำเครื่องหมายเป็นระดับอ้างอิง เส้นสมดุลกลางอัปเดตเมื่อราคาสูงสุดและต่ำสุดใหม่ปรากฏ และ VWAP ถูกยึดติดกับแท่งแรกของช่วงเวลานั้น เมื่อช่วงเวลาปิด ราคาสูงสุดและต่ำสุดจะขยายไปข้างหน้าเป็นระดับเส้นประเข้าสู่ช่วงเวลาถัดไป — ดังนั้นคุณจะรู้ทันทีว่าการเคลื่อนไหวราคาที่ใหม่ยอมรับหรือปฏิเสธช่วงราคาก่อนหน้าหรือไม่
โซนฆ่าถูกวางทับโดยตรงภายในแต่ละกลุ่มช่วงเวลา: เปิดเอเชีย, เปิดลอนดอน, เปิดนิวยอร์ก และปิดนิวยอร์ก เหล่านี้คือช่วงเวลาที่การไหลของคำสั่งสถาบันมีความเคลื่อนไหวมากที่สุดตามประวัติ การเห็นพวกมันในบริบท — ภายในช่วงเวลาที่พวกมันเป็นของ — เปลี่ยนวิธีที่คุณอ่านโครงสร้างตลาดรอบๆ พวกมัน
เมื่อช่วงเวลาปิด แผง RSI ขนาดเล็กจะปรากฏขึ้นโดยอัตโนมัติใต้ช่วงเวลานั้น ตัวแกว่งและเส้นสัญญาณ ถูกวาดตามสัดส่วนกับช่วงราคาของช่วงเวลา มันเป็นการอ่านอย่างรวดเร็วว่าช่วงเวลานั้นมีแนวโน้มอย่างชัดเจน รวบรวม หรือกลับตัว — โดยไม่ต้องเปิดหน้าต่างตัวบ่งชี้แยกต่างหาก
ทำไมสิ่งนี้ถึงดีกว่าตัวบ่งชี้ช่วงเวลาอื่นๆ
เครื่องมือช่วงเวลาส่วนใหญ่หยุดแค่การวาดกล่องสี พวกมันบอกคุณ เมื่อ ช่วงเวลานั้นเกิดขึ้น พวกมันไม่บอกอะไรเกี่ยวกับ สิ่งที่ เกิดขึ้นภายใน Trading Sessions Suite ถือแต่ละช่วงเวลาเป็นหน่วยวิเคราะห์ที่สมบูรณ์: ช่วงราคาของตัวเอง ราคากลางของตัวเอง บริบทโมเมนตัมของตัวเอง และหน้าต่างสภาพคล่องของตัวเอง — ทั้งหมดบนเลเยอร์เดียว ไม่มีแผงเสริม
ตัวบ่งชี้อื่นๆ ทำให้คุณต้องเลือก: กล่องช่วงเวลา หรือ VWAP หรือ โซนฆ่า ที่นี่ ทุกอย่างถูกวางซ้อนกันและจัดกลุ่มอย่างมีเหตุผล — การตั้งค่าเอเชียอยู่กับโซนฆ่าเอเชีย การตั้งค่าลอนดอนอยู่กับโซนฆ่าลอนดอน การตั้งค่านิวยอร์กรวมทั้งโซนฆ่าเปิดและปิด คุณกำหนดตลาด ไม่ใช่รายการพารามิเตอร์ที่แยกจากกัน
เส้นขยายช่วงราคาคือระดับที่สูงขึ้นอีกขั้น เมื่อช่วงเวลาปิด ราคาสูงสุดและต่ำสุดจะฉายไปข้างหน้าและถูกยุติโดยอัตโนมัติทันทีที่ช่วงเวลาถัดไปเปิด ไม่มีการทำความสะอาดด้วยมือ ไม่มีเส้นเก่ารกกราฟ — มีแต่ระดับที่สะอาดและไดนามิกที่สะท้อนว่าช่วงราคาก่อนหน้าถูกช่วงเวลาใหม่ยึดคืนไปแล้วมากน้อยแค่ไหนหรือยังคงเคารพอยู่
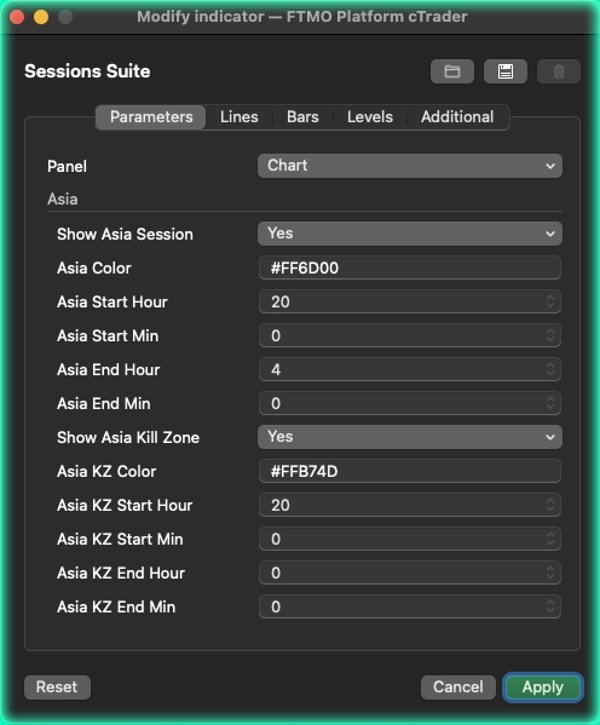
แต่ละช่วงเวลามีความเป็นอิสระเต็มที่ สี เวลา และโซนฆ่าถูกตั้งค่าแยกตามช่วงเวลาในแผงพารามิเตอร์ที่สะอาดและจัดกลุ่ม โซนเวลาคือเมนูแบบเลื่อนลงเดียว — ไม่ต้องจัดรูปแบบสตริง
สิ่งที่คุณจะได้รับ:
กล่องช่วงเวลาสดพร้อมราคาสูงสุด ต่ำสุด ระดับเปิด เส้นกลาง และ VWAP — การขยายช่วงราคาสู่ช่วงเวลาถัดไป ยุติโดยอัตโนมัติเมื่อเปิด — สี่โซนฆ่าจัดกลุ่มกับช่วงเวลาของพวกมัน — แผง RSI ขนาดเล็ก + สัญญาณเมื่อช่วงเวลาปิด — การปรับแต่งสีและเวลาเต็มรูปแบบต่อช่วงเวลา — เมนูโซนเวลาพร้อมตลาดหลักทั้งหมด
สรุป
รีวิวจากลูกค้า
5 | 50 % | |
4 | 50 % | |
3 | 0 % | |
2 | 0 % | |
1 | 0 % |


