
Açıklama
gösterge piyasaların yapısına göre mumları gerçek zamanlı renklendirir ve likidite bölgeleri, kurumsal akışlar ve konsolidasyon aralıkları çizer. Akıllı Para Kavramları (SMC) prensiplerine göre işlem yapan traderlar için tasarlanmıştır.
🧠 Algoritma Mantığı
https://chartshots.spotware.com/c/69f0e3fd81319
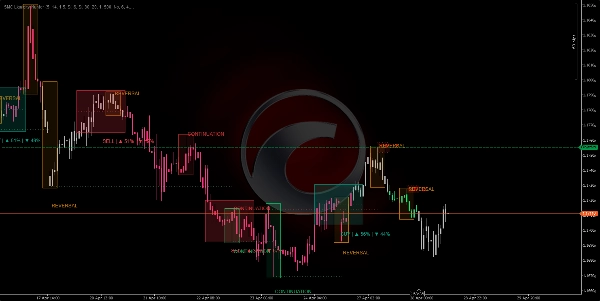
1. Piyasa Yapısı Tespiti 🔍
- Dönüm noktalarını bulur (yerel yüksekler ve düşükler) yapılandırılabilir bir geriye dönük dönem kullanarak.
- Ardışık dönüm noktalarını karşılaştırır yapıyı belirlemek için:
-
- Daha Yüksek Yüksekler + Daha Yüksek Düşükler = Boğa Eğilimi 📈
- Daha Düşük Yüksekler + Daha Düşük Düşükler = Ayı Eğilimi 📉
- Karışık sinyaller = Nötr Eğilim ➡️
- Gürültüyü filtreler: sadece ATR (Ortalama Gerçek Aralık) baz alınarak ayarlanabilir hassasiyetle çarpılan eşik değerini aşan dönüm noktalarını sayar.
https://chartshots.spotware.com/c/69f0e7e752b74
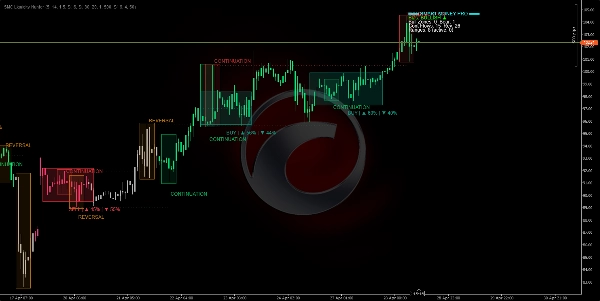
2. Kurumsal Akışlar (Akış Kutuları) 🔄
- Her yeni önemli bir dönüm noktası oluştuğunda, algoritma önceki dönüm noktasından yeni dönüm noktasına yatay bir çizgi çizer.
- Akışı sınıflandırır şu şekilde:
-
- Devam: fiyat trendi korur (yükselişte HL, düşüşte LH) ✅
- Dönüş: fiyat yapıyı kırar (yükselişte LL, düşüşte HH) ⚠️
- Dönüm noktasının etrafına renkli bir kutu "DEVAM" veya "DÖNÜŞ" olarak etiketlenmiş şekilde çizer.
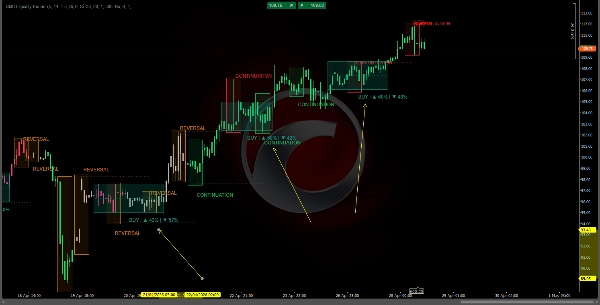
3. Arz/Talep Bölgeleri (Likidite) 💧
https://chartshots.spotware.com/c/69f0e8e7aef29
- Her önemli dönüm noktasının etrafına, geleceğe doğru yapılandırılabilir sayıda bar için yatay bir bant çizilir.
- Bu bölgeler gerçekleşmemiş kurumsal emirleri temsil eder:
-
- Ayı dönüm noktaları → ARZ bölgesi (satış emirleri) 🔴
- Boğa dönüm noktaları → TALEP bölgesi (alış emirleri) 🟢
- Bir bölge kırılır ve kaybolur fiyat yeterince güçlü bir şekilde içine girdiğinde veya ömrü sona erdiğinde.
4. Aralık Tespit Motoru (Konsolidasyonlar) 📦
- Çevresinde Basit Hareketli Ortalama (SMA) ve etrafında ATR bandı hesaplar.
- Eğer her bir bar geriye dönük pencerede bandın içinde kalıyorsa, algoritma bir konsolidasyon aralığı olarak tanımlar.
- Şu özelliklerle mavi bir dikdörtgen çizer:
-
- Noktalı orta çizgi (aralık dengesi) ⚖️
- Kırılma olasılık yüzdesi boğa/ayı bazında:
-
- Yönsel momentum (ADX/DI+ vs DI-) 📐
- Aralık içindeki kümülatif boğa ve ayı hacmi 📊
- Üst ve alt yarıda geçirilen zaman ⏱️
5. Mum Renklendirme (Temiz & Görsel) 🕯️
- Yeşil mum = onaylanmış boğa yapısı (HH+HL) 🟢
- Macenta/Kırmızı mum = onaylanmış ayı yapısı (LH+LL) 🔴
- Gri mum = nötr veya geçiş aşaması ⚪
- Dikdörtgenler üst üste binmez: gerçek fitiller ve gövdeler her zaman tamamen görünür.
📋 Gösterge Paneli (köşe)
Aktif bölgeler, akışlar ve aralıkların sayısal özeti
🛠️ Nasıl Kullanılır
⚙️ Önerilen Ayarlar
- Zaman Dilimi: H1 veya daha yüksek (Akıllı Para için ideal).
- Varsayılan parametreler: Forex, endeksler ve kripto için uygundur.
- Hassasiyeti ayarla: volatil piyasalar için artırın, dalgalı yatay piyasalar için azaltın.
📗 İşlem Kuralları :
✅ Uzun Pozisyon (ALIŞ)
- Mumlar yeşil olmalı (boğa eğilimi aktif) 🟢
- Fiyat aktif bir "TALEP" bölgesine dokunmalı veya yaklaşmalı 🟢
- O bölgede "DEVAM" (dönüş değil) kutusu görünmeli ✅
- Gösterge paneli aktif aralıkta (varsa) > %60 boğa kırılma olasılığı göstermeli 📊
✅ Kısa Pozisyon (SATIŞ)
- Mumlar macenta/kırmızı olmalı (ayı eğilimi aktif) 🔴
- Fiyat aktif bir "ARZ" bölgesine dokunmalı veya yaklaşmalı 🔴
- O bölgede "DEVAM" (dönüş değil) kutusu görünmeli ✅
- Gösterge paneli > %60 ayı kırılma olasılığı göstermeli 📊
❌ İşlem Yapmayın Eğer...
- Mumlar gri (tanımlı eğilim yok) ⚪
- Tam işlem yapacağınız yerde bir "DÖNÜŞ" sinyali görünürse ⚠️
- Fiyat henüz net bir kırılma olmadan mavi bir aralık içindeyse 🔵
- Gösterge paneli karşıt uyum gösteriyorsa (boğa kurulumunda ayı uyumu veya tersi) 🔄
📈 Gösterge Paneli Yorumu
metin
═══ SMART MONEY PRO ═══
Eğilim: BOĞA ▲ ← Mevcut piyasa eğilimi
Boğa Bölgeleri: 2 Ayı: 1 ← Aktif likidite bölgeleri
Devam Akışları: 3 Dönüş: 0 ← Devam ve dönüşler
Aralıklar: 4 (aktif: 1) ← Toplam ve aktif aralıklar
Aktif Aralık ▲%65 ▼%35 ← Kırılma olasılığı
⚡ BOĞA UYUMLULUĞU ← Maksimum hizalanma sinyali
💡 Temel Prensipler
- ✅ Yeniden boyama yok: her şey sadece kapanmış bar verileri kullanılarak hesaplanır.
- ✅ Temiz grafik: renkli gerçek mumlar, yarı saydam bölgeler, görsel karmaşa yok.
- ✅ Yapı önizlemesi: mum rengi, dönüm noktaları belirgin olmadan önce piyasa aşamasını gösterir.
- ✅ Yerleşik uyum: aktif bölge + aktif aralık + akış sinyali hepsi hizalandığında, gösterge paneli bunu açıkça işaretler.
Özet
Key features include:
- **Institutional Flows:** Draws horizontal lines and colored boxes between significant pivots, labeling flows as "CONTINUATION" or "REVERSAL" to indicate trend respect or break.
- **Supply and Demand Zones:** Highlights unexecuted institutional orders with horizontal bands around pivots, distinguishing supply (sell) and demand (buy) zones that expire or break upon price penetration.
- **Range Detection:** Identifies consolidation ranges using an SMA with ATR bands, marking them with blue rectangles and providing breakout probability percentages based on momentum, volume, and time distribution.
- **Dashboard:** Displays numeric summaries of active zones, flows, ranges, and breakout probabilities, including confluence signals when multiple factors align.
Recommended for use on H1 or higher timeframes, the indicator suits Forex, indices, and cryptocurrencies. It operates without repainting by relying on closed bar data and maintains a clean chart presentation with visible candle wicks and bodies.
Müşteri değerlendirmeleri
5 | 50 % | |
4 | 0 % | |
3 | 0 % | |
2 | 50 % | |
1 | 0 % |


