
Smart Support Resistance Break Detector
지표
101 다운로드
버전 1.0, Apr 2026
Windows, Mac
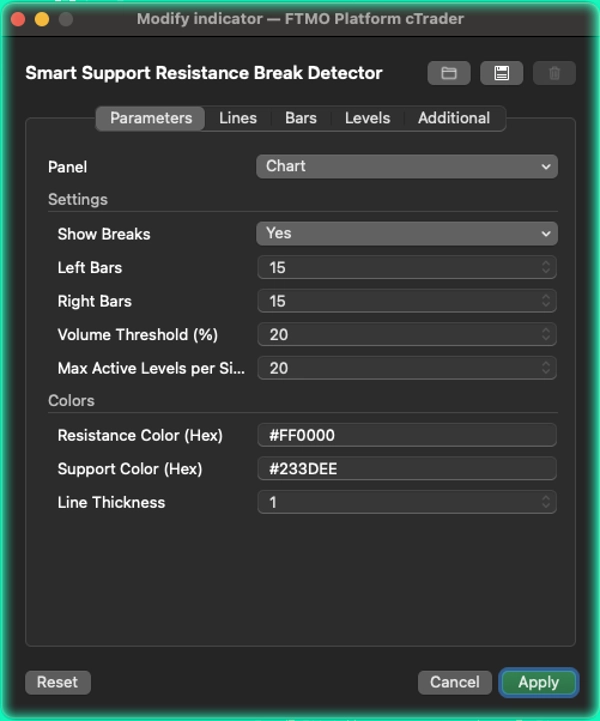
설명
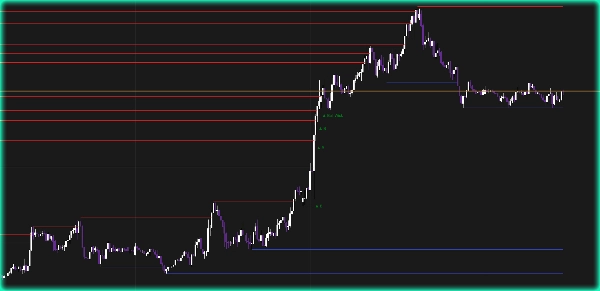
[BeyondTrading]의 지지 및 저항 수준과 돌파 — 모든 실시간 수준과 실제 돌파를 확인하세요. 피벗 고점과 저점을 자동으로 감지하고 차트에 수평 지지 및 저항선을 직접 그립니다. 각 선은 수준이 유지되는 한 실시간으로 바 단위로 확장됩니다. 가격이 이를 돌파해 마감하는 순간, 선은 접촉 지점에서 정확히 멈춥니다. 수동 그리기 없이, 오래된 수준이 차트를 어지럽히지 않습니다.
수준이 돌파되면 즉시 신호가 나타납니다: B는 거래량이 있는 깨끗한 돌파를 의미하며, Bull Wick 또는 Bear Wick은 실제 몸통 마감이 아닌 윅에 의해 마감이 이루어질 때 나타납니다. 거래량 필터는 신뢰도가 낮은 움직임을 제거하고 중요한 신호만 유지합니다.
왜 지지/저항 수준이 중요한가 지지 및 저항 수준은 단순한 선이 아니라 유동성 풀입니다. 가격이 수준을 거부할 때마다, 스톱 주문과 미체결 주문이 그 위아래에 쌓입니다. 가격이 돌아오면 기관들은 수준을 방어하거나 실제 움직임이 시작되기 전에 스톱을 사냥합니다. 세 번 테스트되었지만 깨지지 않은 저항 수준은 우연이 아니며, 매도 주문이 쌓인 곳이고, 움직임이 가짜일 경우 돌파 트레이더들이 갇히는 곳입니다. 아직 활성화된 수준과 이미 돌파된 수준을 아는 것은 다음 반응이 어디서 일어날지 정확히 알려줍니다.
기능
- 모든 거래 스타일에 맞게 구성 가능한 좌측 바 및 우측 바를 이용한 피벗 감지
- 가격이 돌파해 마감하는 즉시 멈추는 동적 바 확장 선
- 실제 돌파와 노이즈를 구분하는 거래량 필터(EMA 5/10 오실레이터)
- 돌파 라벨: 깨끗한 거래량 돌파를 위한 B, 윅에 의한 움직임을 위한 Bull Wick 및 Bear Wick
- 중복 필터링 — 기존 수준과 너무 가까운 수준은 자동으로 무시
- 차트를 깔끔하고 읽기 쉽게 유지하기 위한 각 측면별 최대 활성 수준
- 16진수 입력이 가능한 완전 구성 가능한 저항 및 지지 색상
요약
AI 요약
The Smart Support Resistance Break Detector is an indicator that automatically identifies pivot-based support and resistance levels on trading charts. It detects pivot highs and lows and draws horizontal lines that extend in real time as long as the price respects these levels. When the price closes beyond a level, the corresponding line stops exactly at the breakout point, preventing clutter from outdated levels.
The indicator features volume-confirmed break signals to distinguish genuine breakouts from low-conviction moves. It displays specific labels: "B" for clean volume breaks, and "Bull Wick" or "Bear Wick" when breaks are driven by wicks rather than body closes. A volume filter based on EMA oscillators helps filter out noise.
Additional functionalities include configurable pivot detection parameters (Left Bars and Right Bars), automatic filtering of duplicate levels, and limits on the maximum number of active levels per side to maintain chart clarity. Users can customize support and resistance line colors using hex codes.
This tool is designed to highlight key liquidity pools where institutional orders accumulate, aiding traders in identifying active levels and potential reaction points in the market.
지표 프로필
고객 리뷰
0.0
리뷰: 0
고객 리뷰
이 상품에 대한 리뷰가 아직 없습니다. 이미 사용해 보셨나요? 다른 사람들에게 가장 먼저 소개해 주세요!
상담
자주 묻는 질문(FAQ)
Key Levels
BOS
Liquidity Sweep
Liquidity Grab
Support & Resistance
트레이딩 봇, 지표, 플러그인 등 cTrader Store에서 제공되는 상품은 제3자 개발자에 의해 제공되며, 이는 단순히 정보 및 기술적 접근을 목적으로 제공된 것입니다. cTrader Store는 중개인이 아니며, 투자 조언, 개인별 추천 또는 향후 성과에 대한 어떠한 보장도 제공하지 않습니다.
이 작성자의 상품 더 보기


!["[Stellar Strategies] Smart ADX" 로고](https://cdn.ctrader.com/image/webp/af13b084-b6f6-41db-b7bc-c7e688b57b05_36929)


가격
가입일 21/01/2026
3
판매
186
무료 설치