

คำอธิบาย
สิ่งที่มันดู
นี่ไม่ได้วาดจากไส้เทียนหรือราคาปิด สำหรับแต่ละแท่ง มันสร้างโปรไฟล์ปริมาณจริงโดยใช้หน้าต่าง 5 แท่งแบบเลื่อน แบ่งช่วงราคามาเป็น 200 ช่อง และหาว่าปริมาณมากที่สุดถูกเทรดที่ไหน — นั่นคือระดับที่มันทำงานจาก จากนั้นมันจะสแกนชุดข้อมูลนั้นเพื่อหาจุดสูงและต่ำแบบสวิงโดยใช้ความเร็วการย้อนกลับสองแบบ: แบบเร็วสำหรับจุดหมุนล่าสุด และแบบช้าและกว้างกว่าสำหรับจุดที่มั่นคงมากขึ้น
วิธีอ่าน
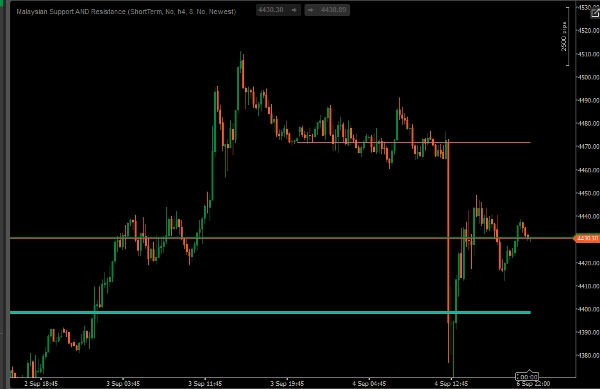
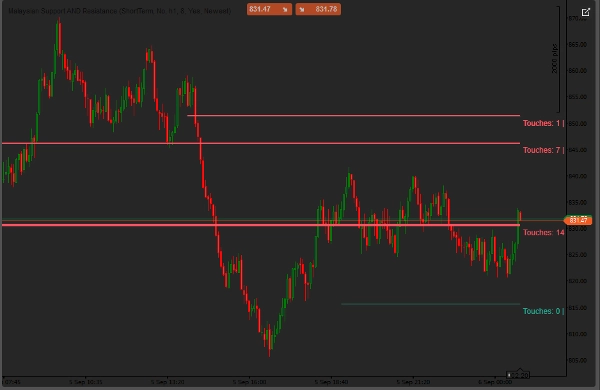
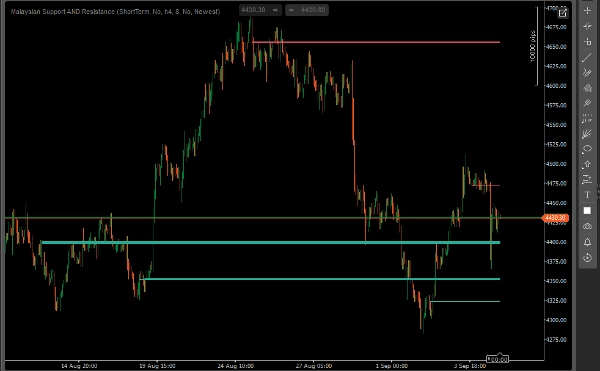
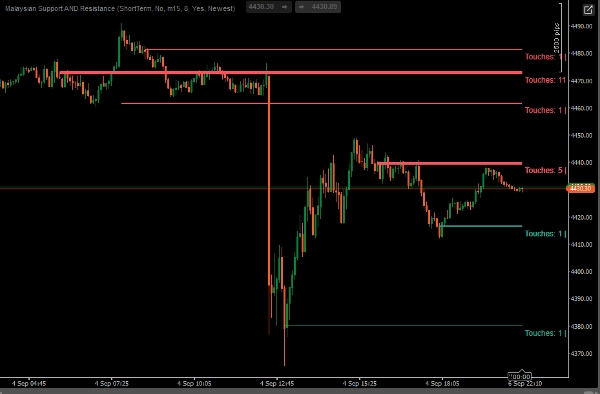
แต่ละเส้นคือระดับแนวรับหรือแนวต้าน สีแสดงว่าราคาปัจจุบันอยู่เหนือเส้นนั้น (แนวรับ) หรือใต้เส้นนั้น (แนวต้าน) ความหนาแสดงความสำคัญ — จำนวนครั้งที่ราคาสัมผัสและปริมาณที่เทรดใกล้เคียง เปิดใช้งาน "แสดงจำนวนการสัมผัส | ปริมาณ" และเลื่อนเมาส์ไปที่เส้นเพื่อดูตัวเลขที่แน่นอน คุณจะเห็นได้สูงสุด 8 ระดับพร้อมกัน: จุดสูง/ต่ำที่เกิดเร็วที่สุดล่าสุด บวกกับจุดสูงที่มั่นคงอีก 3 จุด และจุดต่ำที่มั่นคงอีก 3 จุด
การตั้งค่าหลัก
- มุมมองตลาด — ระยะสั้น / มาตรฐาน / ระยะยาว ควบคุมว่ามองย้อนกลับไปหาจุดหมุนไกลแค่ไหน
- ใช้กรอบเวลาของชาร์ตหรือกรอบเวลาที่สูงกว่าที่ระบุ
- จำนวนเส้นที่จะแสดง — 1 ถึง 8
- เลือกระดับโดย — ใหม่ที่สุด (3 ล่าสุด) หรือ แข็งแกร่งที่สุด (3 ที่ถูกสัมผัสมากที่สุด/ปริมาณสูงสุด ไม่คำนึงถึงอายุ)
- แสดงจำนวนการสัมผัส | ปริมาณ — เพิ่มตัวเลขให้แต่ละเส้น
- สีของแนวรับ/แนวต้าน — ปรับแต่งได้เต็มที่
เหมาะสำหรับใคร
เทรดเดอร์ที่ทำงานกับ price action, SMC หรือแนวคิดสไตล์ ICT ที่ต้องการแนวรับ/แนวต้านที่เป็นวัตถุประสงค์แทนการวาดด้วยมือ ใช้งานได้ดีที่สุดเป็นชั้นความสอดคล้องควบคู่กับโครงสร้างและการอ่านสภาพคล่องของคุณเอง ไม่ใช่สัญญาณเดี่ยว
สิ่งที่ควรรู้
- ระดับจะยืนยันก็ต่อเมื่อผ่านแท่งเทียนเพียงพอที่จะพิสูจน์ — ราคาล่าสุดจะไม่เคลื่อนระดับที่ยืนยันแล้ว
- ปริมาณเป็นปริมาณ tick ซึ่งเป็นมาตรฐานสำหรับ forex/CFDs/synthetics — ไม่ใช่ปริมาณที่เทรดในตลาดแลกเปลี่ยน
- ให้เวลามันมีประวัติทำงาน ในเครื่องมือที่เพิ่งเพิ่มใหม่หรือเงียบสงบ คุณอาจเห็นระดับน้อยกว่า 8 ระดับในตอนแรก และจะเพิ่มขึ้นเมื่อจุดหมุนยืนยันมากขึ้น
สรุป
Displayed lines represent support or resistance, with color indicating whether the current price is above (support) or below (resistance) the level. Line thickness reflects importance based on the frequency of price touches and volume traded near the level. Users can view up to eight levels simultaneously, including the newest fast-forming pivots and multiple established highs and lows. Additional features include customizable settings for market view (short to long term), timeframe selection, number of lines shown, level selection criteria (newest or strongest), and display of touch and volume counts.
This indicator is designed for traders employing price action, Smart Money Concepts (SMC), or ICT-style methods who prefer objective support and resistance levels derived from volume data rather than manual drawing. It functions best as a complementary tool alongside other structural and liquidity analyses. The volume data used is tick volume, standard for forex, CFDs, and synthetic instruments.














!["High-Low Divergence [Iridio Capital]" โลโก้](https://cdn.ctrader.com/image/webp/10a9e91b-243a-43f6-bbfe-7376bad5a214_61554)


