

Dynamic Bands VWAP
อินดิเคเตอร์
1 การซื้อ
เวอร์ชัน 1.0, Jul 2026
Windows, Mac
ตั้งแต่ 24/03/2026
13
การขาย
112
ติดตั้งฟรี
คำอธิบาย
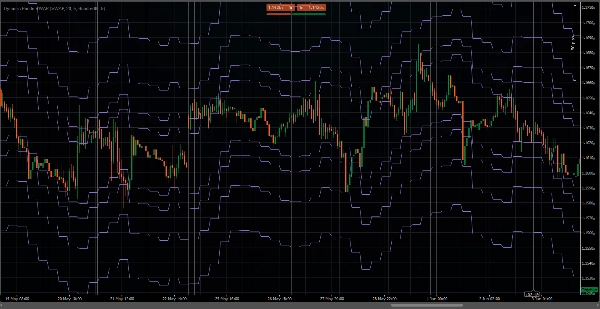
อย่าเชื่อระดับแนวรับแนวต้านแบบคงที่ ตัวบ่งชี้นี้รวม Fibonacci และ VWAP ที่ใช้กันอย่างแพร่หลายไว้ในชุดเดียวที่แก้ไขข้อจำกัดของแต่ละอย่าง ตอนนี้ระดับทั้งหมดเป็นแบบไดนามิก โดยอิงจาก กระแสเงิน, บล็อกเวลา และ กฎคณิตศาสตร์.
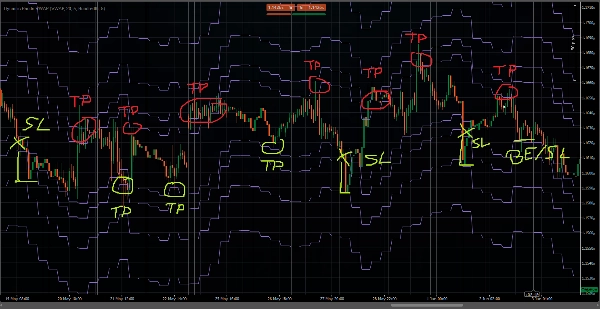
ตัวบ่งชี้นี้วาดบันไดขั้นของเส้นแนวนอนโดยอิงจากค่าเฉลี่ย VWAP/TWAP เคลื่อนที่ แทนที่จะเป็นเส้นต่อเนื่องเรียบ มันจะคำนวณค่าเฉลี่ยใหม่ทุกๆ X แท่ง (“ขั้นบันได”) วาดส่วนแนวนอนแบนที่กระโดดขึ้นลงไปยังระดับใหม่ในแต่ละขั้น ระยะห่างของเส้นเหนือและใต้ VWAP/TWAP เป็นไปตามลำดับ Fibonacci คูณด้วยสเกลเปอร์เซ็นต์ที่ผู้ใช้เลือก (สเกล Fibonacci).
พารามิเตอร์
- ประเภทค่าเฉลี่ย – VWAP (ถ่วงน้ำหนักตามปริมาณ) หรือ TWAP (ถ่วงน้ำหนักตามเวลา).
- ช่วงเวลา (แท่ง) – หน้าต่างย้อนหลังสำหรับการคำนวณค่าเฉลี่ย.
- จำนวนเส้นเหนือ/ใต้ – จำนวนระดับที่เว้นระยะตาม Fibonacci ที่จะวาดในแต่ละด้าน (≥2).
- สเกล Fibonacci – หน่วยเปอร์เซ็นต์ฐานสำหรับการเว้นระยะ.
- อัปเดตทุก X แท่ง – ความถี่ในการคำนวณบันไดใหม่; ค่าเฉลี่ยและเส้นทั้งหมดจะคงที่ระหว่างการอัปเดต.
วิธีใช้? สามารถใช้เป็น:
- กลยุทธ์การกลับตัวค่าเฉลี่ยทั้งหมด
- การตรวจสอบแนวรับและแนวต้าน
- ราคาที่ดีที่สุดสำหรับการเข้าและออก
- ตัวแกว่งเกินซื้อ/เกินขาย
- การรวมหลายกรอบเวลา (MTF Confluence)
- การแทนที่เต็มรูปแบบของ Bollinger Bands
- และอื่นๆ.
สรุป
AI summary
Dynamic Bands VWAP is a technical indicator that integrates Fibonacci levels with VWAP (Volume Weighted Average Price) or TWAP (Time Weighted Average Price) to provide dynamic support and resistance levels. Unlike static levels, this indicator recalculates averages and plots horizontal lines in a stepped ladder format every set number of bars, creating flat segments that adjust vertically at each update. The spacing of these lines above and below the average follows a Fibonacci sequence scaled by a user-defined percentage.
Key parameters include the choice between VWAP or TWAP averages, the lookback period for calculations, the number of Fibonacci-spaced lines displayed above and below the average, the Fibonacci scale for spacing, and the frequency of updates (every X bars). The indicator bases its dynamic levels on money flow, time blocks, and mathematical rules.
It can be applied in various trading contexts such as mean-reversion strategies, support and resistance validation, identifying optimal entry and exit prices, overbought/oversold oscillation, multi-timeframe confluence, and as a full alternative to Bollinger Bands. The indicator supports volume and bar data inputs and provides visualizations, signals for breakouts, reversals, volatility regimes, and level touches or breaks.
Key parameters include the choice between VWAP or TWAP averages, the lookback period for calculations, the number of Fibonacci-spaced lines displayed above and below the average, the Fibonacci scale for spacing, and the frequency of updates (every X bars). The indicator bases its dynamic levels on money flow, time blocks, and mathematical rules.
It can be applied in various trading contexts such as mean-reversion strategies, support and resistance validation, identifying optimal entry and exit prices, overbought/oversold oscillation, multi-timeframe confluence, and as a full alternative to Bollinger Bands. The indicator supports volume and bar data inputs and provides visualizations, signals for breakouts, reversals, volatility regimes, and level touches or breaks.
โปรไฟล์อินดิเคเตอร์
หมวดหมู่อินดิเคเตอร์
แนวรับและแนวต้าน
ประเภทเอาต์พุต
การแสดงเป็นภาพ
สัญญาณ
ตัวกรอง
ข้อกำหนดด้านข้อมูล
แท่งเท่านั้น
ปริมาณ
สัญญาณที่รองรับ
Breakout
Reversal
ความผันผวน
แตะ Level ที่ระบุ
เบรก Level ที่ระบุ
รีวิวจากลูกค้า
0.0
รีวิว: 0
รีวิวจากลูกค้า
ยังไม่มีรีวิวสำหรับผลิตภัณฑ์นี้ หากเคยลองแล้ว ขอเชิญมาเป็นคนแรกที่บอกคนอื่น!
การสนทนา
คำถามที่พบบ่อย
Fibonacci
Key Levels
Volume
VWAP
Support & Resistance
ผลิตภัณฑ์ที่มีให้บริการผ่าน cTrader Store รวมถึงบอทการเทรด อินดิเคเตอร์ และปลั๊กอิน มีให้บริการโดยนักพัฒนาบุคคลที่สามและมีไว้เพื่อวัตถุประสงค์ในการเข้าถึงข้อมูลและทางเทคนิคเท่านั้น cTrader Store ไม่ใช่โบรกเกอร์และไม่ได้ให้คำแนะนำการลงทุน คำแนะนำส่วนบุคคล หรือการรับประกันผลการดำเนินงานในอนาคต






















ราคา
ตั้งแต่ 24/03/2026
13
การขาย
112
ติดตั้งฟรี