
SupertrendChannels
อินดิเคเตอร์
เวอร์ชัน 1.0, Jul 2025
Windows, Mac
4.5
รีวิว: 2
คำอธิบาย
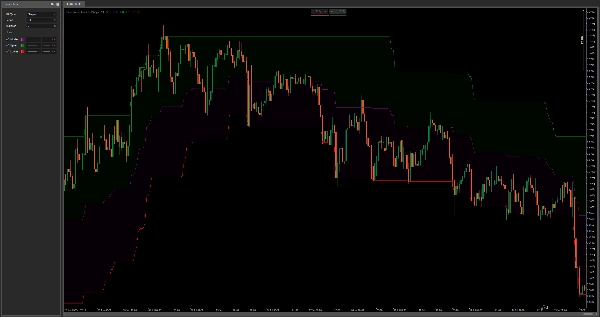
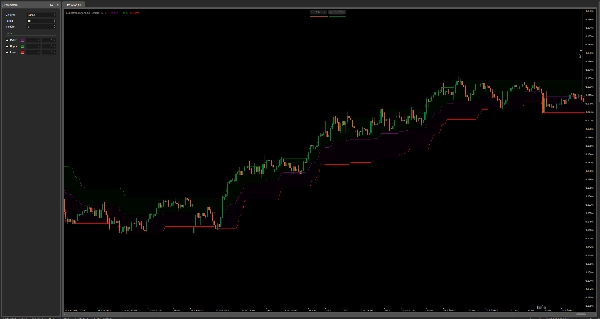
Supertrend Channels เป็นตัวบ่งชี้แบบโอเวอร์เลย์ที่กำหนดเองซึ่งออกแบบมาเพื่อช่วยให้นักเทรดสามารถระบุด้วยสายตา โซนแนวรับและแนวต้านแบบไดนามิก, สัญญาณเข้า, และ ระดับการหยุดขาดทุนแบบติดตาม โดยใช้ตรรกะที่อิงกับ ATR.
ตัวบ่งชี้จะแสดงเส้นสามเส้น:
- Upper Band (สีเขียว) – ทำหน้าที่เป็นแนวต้านแบบไดนามิกหรือการหยุดขาดทุนแบบติดตามสำหรับการเทรดแบบยาว.
- Lower Band (สีแดง) – ทำหน้าที่เป็นแนวรับแบบไดนามิกหรือการหยุดขาดทุนแบบติดตามสำหรับการเทรดแบบสั้น.
- Middle Line (สีม่วง) – ทำหน้าที่เป็นระดับการกลับตัวเฉลี่ยหรือจุดเข้าเทรดที่เป็นไปได้.
มันคำนวณแถบโดยใช้ค่า Average True Range (ATR) คูณด้วยปัจจัยที่ผู้ใช้กำหนด (Multiplier) และบวก/ลบจากราคาสูงสุด/ต่ำสุดของแท่งเทียนปัจจุบัน มีการใช้วิธีการปรับเรียบ (ประเภท MA ที่เลือกได้) กับ ATR เพื่อปรับความไว.
วิธีใช้:
- การเข้าเทรด: มองหาจุดเข้าเทรดใกล้ เส้นกลาง ในช่วงการรวมตัวหรือหลังสัญญาณการตัดกัน.
- การหยุดขาดทุนแบบติดตาม: ใช้ แถบบน/ล่าง เป็นโซนออกแบบไดนามิกเพื่อรักษากำไรเมื่อแนวโน้มขยายตัว.
- แนวรับ & แนวต้าน: แถบเหล่านี้ทำหน้าที่เหมือนโซนปรับตัวที่สะท้อนความผันผวนล่าสุดและช่วยให้เห็นจุดกลับตัวที่เป็นไปได้.
แตกต่างจาก Bollinger Bands มาตรฐาน วิธีนี้จะยึดแถบจาก ราคาสูงสุดต่ำสุดบวกกับความผันผวน ไม่ใช่ค่าเฉลี่ยเคลื่อนที่ ทำให้ตอบสนองได้ดีขึ้นในสภาพแวดล้อมที่มีแนวโน้มและปรับตัวได้มากขึ้นสำหรับการเทรดแบบดุลยพินิจหรือแบบอัลกอริทึม.
สรุป
โปรไฟล์อินดิเคเตอร์
รีวิวจากลูกค้า
4.5
รีวิว: 2
5 | 50 % | |
4 | 50 % | |
3 | 0 % | |
2 | 0 % | |
1 | 0 % |
รีวิวจากลูกค้า
July 26, 2025
the idea is fine, just do not expect it to print perfect entries. Win rate means less without average R.
July 25, 2025
The reason it feels usable is the plan does not get lost as quickly. The market context still matters.
การสนทนา
คำถามที่พบบ่อย
ผลิตภัณฑ์ที่มีให้บริการผ่าน cTrader Store รวมถึงบอทการเทรด อินดิเคเตอร์ และปลั๊กอิน มีให้บริการโดยนักพัฒนาบุคคลที่สามและมีไว้เพื่อวัตถุประสงค์ในการเข้าถึงข้อมูลและทางเทคนิคเท่านั้น cTrader Store ไม่ใช่โบรกเกอร์และไม่ได้ให้คำแนะนำการลงทุน คำแนะนำส่วนบุคคล หรือการรับประกันผลการดำเนินงานในอนาคต


ราคา
ตั้งแต่ 03/01/2025
638.03K
ปริมาณการเทรด
21.34K
Pips ที่ได้กำไร
15
การขาย