
VixFix
อินดิเคเตอร์
เวอร์ชัน 1.0, Jul 2025
Windows, Mac
4.0
รีวิว: 1
คำอธิบาย
ตัวบ่งชี้ VixFix สำหรับ cTrader
จับความตื่นตระหนกของตลาดก่อนที่จะมีข่าว
ตัวบ่งชี้ VixFix นี้เป็นการปรับใช้แนวคิด “VIX Fix” คลาสสิกของ Larry Williams อย่างชาญฉลาด—ออกแบบมาเพื่อช่วยเทรดเดอร์ตรวจจับความกลัวและความผันผวนในระยะสั้น โดยเฉพาะอย่างยิ่งมีประโยชน์ในการระบุ จุดต่ำสุดของตลาดที่เป็นไปได้.
วิธีการทำงาน
- คำนวณการพุ่งขึ้นของความผันผวนเทียมโดยเปรียบเทียบราคาต่ำสุดล่าสุดกับราคาสูงสุดในช่วงเวลาที่กำหนดได้ (ค่าเริ่มต้น: 12)
- ใช้ค่าเฉลี่ยเคลื่อนที่และซองความเบี่ยงเบนมาตรฐานเพื่อแยก สัญญาณการพุ่งขึ้น ออกจากเสียงรบกวนปกติ
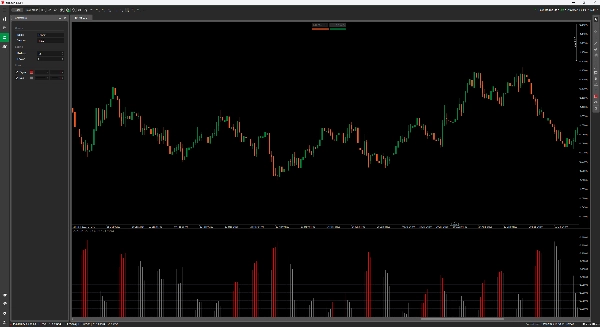
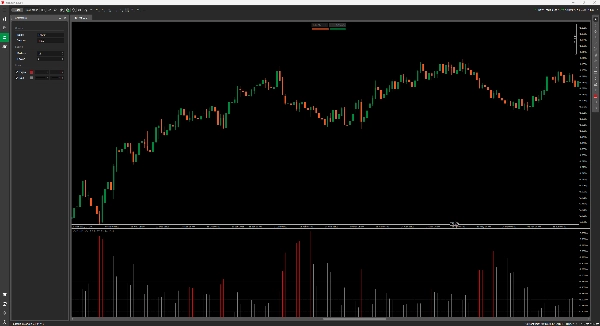
- แสดง แท่งฮิสโตแกรมสีแดง เมื่อความผันผวนเกินเกณฑ์—เป็นสัญญาณให้คุณเริ่มให้ความสนใจ
คุณสมบัติ
- การแสดงฮิสโตแกรมที่สะอาด (ไม่ซ้อนทับ)
- การแสดงผลสองสี:
-
- สีแดง = สัญญาณ (ความผันผวนพุ่งสูงเกินเกณฑ์)
- สีเทา = กิจกรรมปกติ
- ปรับ ช่วงเวลา และ ปัจจัยความไว
- ไม่มีความล่าช้าของตัวบ่งชี้—ใช้เพียงการเคลื่อนไหวราคาดิบเท่านั้น ไม่มีการวาดซ้ำ
กรณีการใช้งาน
- ตรวจจับ การกลับตัวที่เป็นไปได้ ในแนวโน้มขาลง
- กำหนดเวลา การเทรดแบบกลับสู่ค่าเฉลี่ย
- ยืนยัน สภาวะขายเกิน โดยไม่ต้องพึ่งพา RSI หรือเครื่องมือที่ล่าช้าอื่นๆ
สรุป
โปรไฟล์อินดิเคเตอร์
รีวิวจากลูกค้า
4.0
รีวิว: 1
5 | 0 % | |
4 | 100 % | |
3 | 0 % | |
2 | 0 % | |
1 | 0 % |
การสนทนา
คำถามที่พบบ่อย
ผลิตภัณฑ์ที่มีให้บริการผ่าน cTrader Store รวมถึงบอทการเทรด อินดิเคเตอร์ และปลั๊กอิน มีให้บริการโดยนักพัฒนาบุคคลที่สามและมีไว้เพื่อวัตถุประสงค์ในการเข้าถึงข้อมูลและทางเทคนิคเท่านั้น cTrader Store ไม่ใช่โบรกเกอร์และไม่ได้ให้คำแนะนำการลงทุน คำแนะนำส่วนบุคคล หรือการรับประกันผลการดำเนินงานในอนาคต


ราคา
ตั้งแต่ 03/01/2025
638.03K
ปริมาณการเทรด
21.34K
Pips ที่ได้กำไร
15
การขาย