
HTFBB
อินดิเคเตอร์
1 การซื้อ
เวอร์ชัน 1.0, Jul 2025
Windows, Mac
5.0
รีวิว: 1
คำอธิบาย
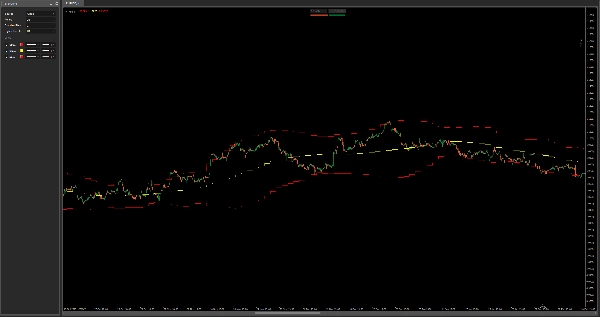
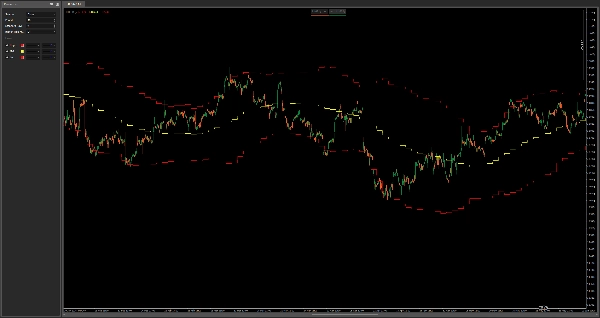
HTF Bollinger Bands – แผนที่ความผันผวนหลายกรอบเวลา
ตัวบ่งชี้นี้แสดง Bollinger Bands จากกรอบเวลาที่สูงกว่า ลงบนแผนภูมิปัจจุบันของคุณ ให้บริบทที่ทรงพลังเกี่ยวกับความผันผวน การกลับสู่ค่าเฉลี่ย และแนวรับ/แนวต้านแบบไดนามิก—ทั้งหมดนี้โดยไม่ต้องเปลี่ยนกรอบเวลา
คุณสมบัติ:
- แสดง Bollinger Bands บน, กลาง และล่าง จากกรอบเวลาที่สูงกว่าใดก็ได้ที่เลือกได้
- เหมาะสำหรับการสังเกต โซนการรวมตัวของ HTF, แรงกดดันการเบรกเอาท์ และ การดึงกลับของแนวโน้ม
- เหมาะสำหรับการเก็งกำไรระยะสั้นและการเข้าซื้อขายภายในวันโดยมีความตระหนักในกรอบเวลาที่สูงกว่า
- ใช้งานได้กับสินทรัพย์และกรอบเวลาทุกประเภท
ผสานรวมกับกลยุทธ์ปัจจุบันของคุณเพื่อหลีกเลี่ยงการซื้อขายในกับดักความผันผวนและรักษาความสอดคล้องกับโครงสร้างราคาขนาดใหญ่
สรุป
โปรไฟล์อินดิเคเตอร์
รีวิวจากลูกค้า
5.0
รีวิว: 1
5 | 100 % | |
4 | 0 % | |
3 | 0 % | |
2 | 0 % | |
1 | 0 % |
รีวิวจากลูกค้า
July 29, 2025
confusing signals get easier to ignore, but a clean signal can still fail.
การสนทนา
คำถามที่พบบ่อย
ผลิตภัณฑ์ที่มีให้บริการผ่าน cTrader Store รวมถึงบอทการเทรด อินดิเคเตอร์ และปลั๊กอิน มีให้บริการโดยนักพัฒนาบุคคลที่สามและมีไว้เพื่อวัตถุประสงค์ในการเข้าถึงข้อมูลและทางเทคนิคเท่านั้น cTrader Store ไม่ใช่โบรกเกอร์และไม่ได้ให้คำแนะนำการลงทุน คำแนะนำส่วนบุคคล หรือการรับประกันผลการดำเนินงานในอนาคต


ราคา
ตั้งแต่ 03/01/2025
638.03K
ปริมาณการเทรด
21.34K
Pips ที่ได้กำไร
15
การขาย