
คำอธิบาย
QX FrameForge คือแดชบอร์ดสถานะตลาดแบบหลายกรอบเวลาซ้อนทับ multi-timeframe market-state dashboard สำหรับ cTrader มันบีบอัดสิ่งที่เกิดขึ้นในหลายกรอบเวลาให้เป็นแผงที่อ่านได้อย่างรวดเร็ว เพื่อให้คุณสามารถเทรดโดยมีบริบทแทนการเดา
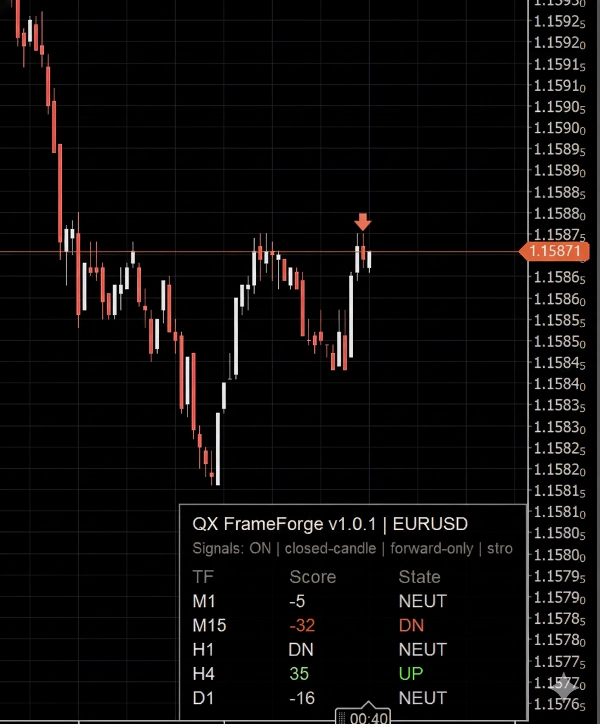
สำหรับแต่ละกรอบเวลาที่เลือก แผงจะแสดง:
- TF (กรอบเวลา)
- Score (-100 ถึง +100) เพื่อแสดงทิศทางและความแข็งแกร่ง
- State: ขึ้น / เป็นกลาง / ลง สำหรับการตัดสินใจอย่างรวดเร็ว
ลูกศรเสริมสามารถเปิดใช้งานเพื่อทำเครื่องหมายการยืนยันโดยใช้ แท่งเทียนที่ปิดแล้วเท่านั้น ซึ่งช่วยให้กราฟมีความเสถียรและหลีกเลี่ยงการกระพริบภายในแท่งเทียน
วิธีการอ่าน (เหมาะสำหรับผู้เริ่มต้น)
คิดว่าแผงนี้เป็น มาตรวัดทิศทาง:
- คะแนนบวก และ ขึ้น หมายถึงสภาวะกระทิงในกรอบเวลานั้น
- คะแนนลบ และ ลง หมายถึงสภาวะหมีในกรอบเวลานั้น
- เป็นกลาง หมายถึงสภาวะผสม ผันผวน หรือไม่แข็งแรงพอที่จะมีทิศทาง
การตั้งค่า โซนเป็นกลาง ควบคุมว่าตัวบ่งชี้จะเปลี่ยนเป็นเป็นกลางได้ง่ายเพียงใด โซนเป็นกลางที่กว้างขึ้นจะทำให้สถานะทิศทางน้อยลง (ระมัดระวังมากขึ้น)
สิ่งที่อยู่ในคะแนน (ภาพรวมระดับสูง)
คะแนนผสมผสาน:
- ส่วนประกอบ แนวโน้ม (พฤติกรรมทิศทางและความชัน)
- ส่วนประกอบ โมเมนตัม (ความแข็งแกร่งของการต่อเนื่องเทียบกับความลังเล)
- ตัวกรอง ความผันผวน ที่เป็นทางเลือกเพื่อลดช่วงเวลาที่มีเสียงรบกวน
ผลลัพธ์คือคะแนนที่มีขอบเขตออกแบบมาเพื่อ การจัดแนวหลายกรอบเวลา ไม่ใช่สำหรับ “การเข้าตลาดมหัศจรรย์”
วิธีที่เทรดเดอร์มักใช้ FrameForge
1) การจัดแนวหลายกรอบเวลา
- ชอบเทรดเมื่อกรอบเวลาที่สูงกว่าตกลงกัน (ตัวอย่าง: H1 + H4 ทั้งคู่ขึ้น)
- ใช้กรอบเวลาที่ต่ำกว่า (ตัวอย่าง: M5) สำหรับการจับจังหวะ
2) การกรองสภาวะตลาด
- สถานะ เป็นกลาง มากเกินไปมักหมายถึงสภาวะผันผวนและคุณภาพต่ำ
- ทิศทางกรอบเวลาสูงที่ผสมกันแนะนำให้ระมัดระวังหรือเปิดรับความเสี่ยงน้อยลง
3) ชั้นยืนยัน
- ใช้ FrameForge เพื่อยืนยันว่าเซ็ตอัพของคุณสอดคล้องกันก่อนที่คุณจะลงมือ
ลูกศรเสริม (สัญญาณ)
ลูกศรเป็นตัวช่วยทางสายตาแบบเลือกใช้ พวกมันถูกประเมินบน แท่งเทียนที่ปิดล่าสุด เท่านั้น
คุณสามารถเลือกวิธีที่ลูกศรทำงานได้:
- เฉพาะเมื่อความแข็งแกร่งข้ามเกณฑ์,
- เฉพาะเมื่อสถานะทิศทางเปลี่ยน,
- หรือบ่อยขึ้นเมื่อสภาวะยังคงแข็งแกร่ง
มีการควบคุมสำหรับ:
- เกณฑ์ความแข็งแกร่ง
- ช่วงเวลาระหว่างสัญญาณ (จำนวนแท่งเทียนขั้นต่ำระหว่างลูกศร)
- สัญญาณหนึ่งครั้งต่อการแกว่ง (ลดการแสดงลูกศรซ้ำในทิศทางเดียวกัน)
- จำกัดไอคอน (ป้องกันความรกของกราฟ)
สำคัญ: ลูกศรถูกออกแบบให้ แสดงไปข้างหน้าเท่านั้น ตั้งแต่คุณเปิดใช้งาน เพื่อหลีกเลี่ยงการแสดงวัตถุย้อนหลังและภาพลวงตาที่ทำให้เข้าใจผิด
ความเข้ากันได้
- ใช้งานได้กับ สัญลักษณ์ cTrader ทุกตัว และทุกกรอบเวลาของกราฟ
- เป็นเพียงตัวบ่งชี้ ไม่มีการวางคำสั่งซื้อขาย.
- ปรับปรุง UI ให้ตอบสนองได้ดีขึ้น
ข้อจำกัดความเสี่ยง
การเทรดมีความเสี่ยง ผลการดำเนินงานในอดีตไม่รับประกันผลลัพธ์ในอนาคต
สรุป
The Score integrates trend direction and slope, momentum strength, and an optional volatility filter to reduce noise, producing a bounded metric aimed at multi-timeframe alignment rather than precise entry signals. Traders typically use FrameForge for aligning trades across timeframes (e.g., confirming higher timeframe trends before timing entries on lower timeframes), filtering market regimes by identifying choppy or mixed conditions, and adding a confirmation layer to their setups.
Arrow signals can be customized by strength thresholds, directional changes, cooldown periods, and icon limits to avoid chart clutter. The indicator works on any cTrader symbol and timeframe, updating efficiently to maintain chart responsiveness. It does not place orders and serves solely as a visual analytical tool.
รีวิวจากลูกค้า
5 | 100 % | |
4 | 0 % | |
3 | 0 % | |
2 | 0 % | |
1 | 0 % |


