
الوصف
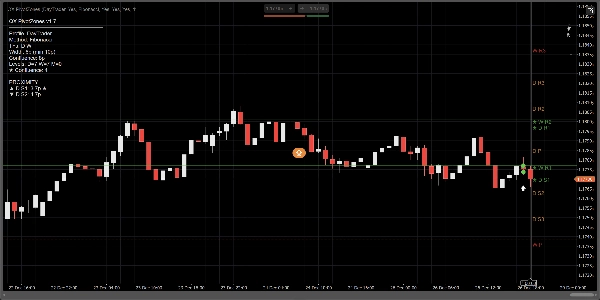
QX PivotZones هو مؤشر نقاط محورية مبني لـ قرارات تداول حقيقية، وليس مجرد خطوط ثابتة يتجاهلها السعر"
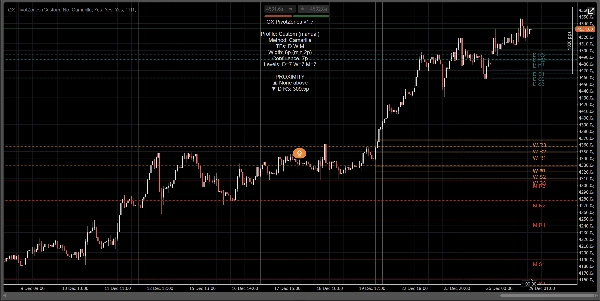
يقوم بحساب النقاط المحورية اليومية، الأسبوعية، والشهرية باستخدام الكلاسيكية، فيبوناتشي، كاماريلا، أو وودي، ويرسمها كـ مناطق سعرية حقيقية (أشرطة) بعرض قابل للتعديل (نقاط أو مبني على ATR). الجوهر بسيط: يبرز تلقائيًا تلاقي الأطر الزمنية المتعددة ويحول النقاط المحورية إلى مناطق قابلة للتنفيذ، وليس "خيالات الخط المثالي".
لماذا هو مختلف عن أدوات نقاط فيبوناتشي المحورية النموذجية:
معظم مؤشرات "FiboPoints" تتوقف عند خطوط المحور الأساسية. يضيف QX PivotZones ما يحتاجه المتداولون فعليًا:
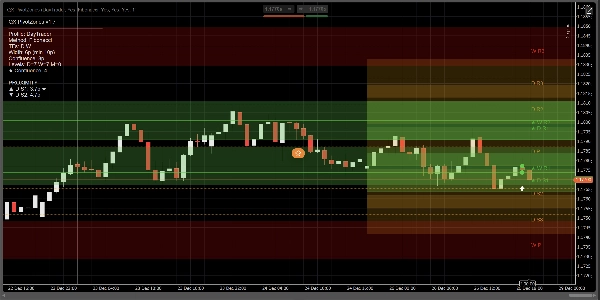
- كشف تلقائي لتلاقي D/W/M: عندما تتجمع النقاط المحورية من أطر زمنية مختلفة، يتم تمييز المستوى (★) ورسمه باستخدام لون التلاقي.
- مناطق (أشرطة) بدلاً من خطوط رفيعة: تحديد العرض بالنقاط أو ATR. هذا يقلل من الضوضاء الناتجة عن ردود فعل "اللمس تقريبًا".
- مرشح المستويات الأقرب (اختياري): عرض المناطق الأكثر صلة فقط فوق وتحت السعر الحالي.
- تنبيهات مفيدة: تفعيل عند دخول المنطقة، لمس الخط، أو كليهما، مع فترة تبريد وترشيح اختياري "للتلاقي فقط".
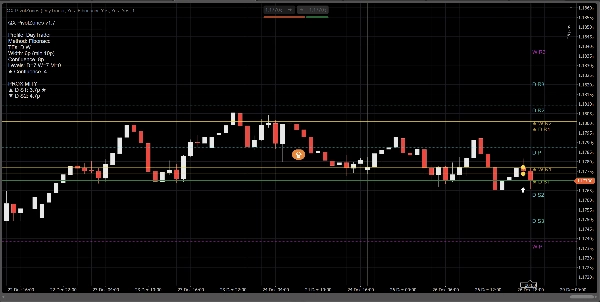
- لوحة المعلومات + القرب: عرض الأطر الزمنية المفعلة، الطريقة، عرض المنطقة، عدد التلاقي، والمسافة إلى أقرب منطقة فوق/تحت.
كيفية الاستخدام:
1) اختر ملف تعريف
- المتداول السريع: تداول داخل اليوم، مستويات أقل، مناطق متكيفة ضيقة.
- متداول اليوم: يومي + أسبوعي (افتراضي).
- التأرجح: يومي + أسبوعي + شهري.
- مخصص: تحكم يدوي في كل شيء.
نصيحة: إذا كنت تريد "متداول اليوم + شهري"، قم بإلغاء تفعيل تجاوزات الملف الشخصي (أو استخدم المخصص) وفعل عرض الشهري يدويًا.
2) ضبط المناطق (النقطة الأساسية)
تحت وضع عرض المنطقة:
- نقاط لأشرطة ثابتة ومتسقة.
- ATR لأشرطة متكيفة مع التقلب.
المعلمات الرئيسية:
- عرض المنطقة (نقاط) أو معامل ATR k
- الحد الأدنى لعرض المنطقة (نقاط) لتجنب أن تصبح الأشرطة رفيعة جدًا
- تعبئة المناطق لرسم المناطق
- تمديد المناطق إلى اليمين لإسقاط الأشرطة إلى الجانب الأيمن المرئي
3) تفعيل التلاقي (المميز الرئيسي)
- تمييز التلاقي: تشغيل
- وضع التلاقي:
-
- نقاط لتحمل ثابت
- ATR لتحمل متكيف
- مسافة التلاقي أو معامل ATR k للتلاقي
المستويات المتلاقية تحصل على:
- لون التلاقي
- علامة ★ على التسمية
- العدد المعروض في اللوحة
4) التنبيهات (تداول بدون التحديق في الشاشة)
- التنبيهات: دخول المنطقة، لمس الخط، أو كلاهما
- تنبيهات: للتلاقي فقط: يقلل الضوضاء
- فترة تبريد التنبيه (الأشرطة): يمنع التكرار المزعج
- رسم أيقونات التنبيه: يحدد الأحداث على الرسم البياني
إعدادات سريعة مقترحة
التداول السريع (M5–M15)
- وضع عرض المنطقة: ATR
- معامل ATR k: 0.15–0.25
- وضع التلاقي: نقاط
- مسافة التلاقي: 4–8 نقاط
- عرض المناطق الأقرب فقط: تشغيل (3 فوق / 3 تحت)
تداول اليوم (M15–H1)
- وضع عرض المنطقة: نقاط
- العرض: 6–10 نقاط
- التلاقي: 8–12 نقاط
- تفعيل اليومي + الأسبوعي
التأرجح (H4–D1)
- وضع عرض المنطقة: ATR
- معامل ATR k: 0.25–0.45
- تفعيل اليومي + الأسبوعي + الشهري
ما يفعله (وما لا يفعله)
- هذا ليس مولد إشارات شراء/بيع.
- إنه خريطة هيكل السوق / مناطق دعم ومقاومة مع تنبيهات الأحداث (دخول/لمس) و تمييز التلاقي.
- أفضل حالات الاستخدام: ردود الفعل عند النقاط المحورية، الرفض/القبول، التراجعات، الأهداف، تقليل المخاطر، وحماية التداول.
الملخص
تقييمات العملاء
5 | 100 % | |
4 | 0 % | |
3 | 0 % | |
2 | 0 % | |
1 | 0 % |


![شعار "Smart Money Concepts (SMC) [Iridio Capital]"](https://cdn.ctrader.com/image/webp/28b69fd1-ef54-4bed-9487-07e78e883be4_40934)


