
الوصف
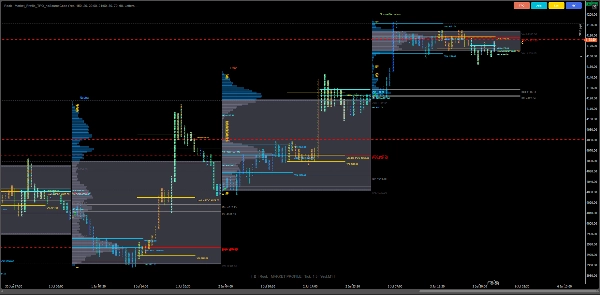
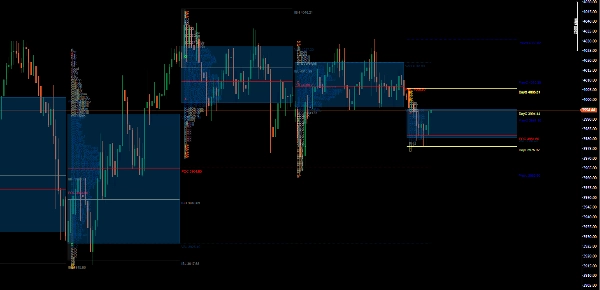
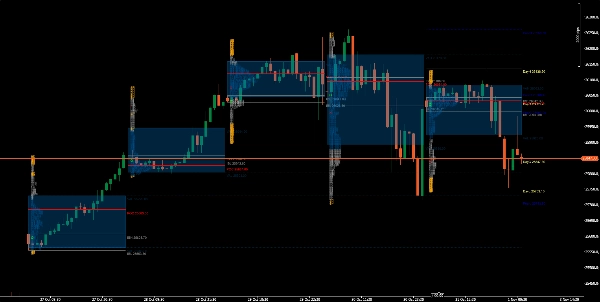
ملف السوق TPO (فرصة السعر والوقت) يجلب تصور هيكل السوق بمستوى مؤسسي إلى cTrader — مما يمكّن المتداولين من رؤية كيفية تفاعل السعر والوقت والحجم عبر الجلسات في عرض ذكي واحد.
مصمم للمتداولين المحترفين اليوميين، ومحللي سوق المزاد، وهواة تدفق الأوامر، يقدم هذا المؤشر تمثيلاً حقيقياً لنشاط السوق باستخدام حروف TPO، والصناديق، والهيستوجرامات. يساعدك على تحديد مناطق القيمة، ومناطق POC، ونطاقات التوازن الأولي، والمستويات العارية بدقة متناهية.
⚙️ الميزات الأساسية
✅ تصور (TPO)
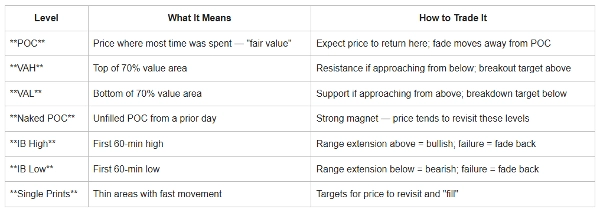
✅ مناطق POC ومنطقة القيمة
✅ تطوير POC
✅ اكتشاف التوازن الأولي (IB)
✅ ذكاء الجلسة والمنطقة الزمنية
✅ أوضاع عرض TPO (حروف / هيستوجرام)
✅ علامات سعر الافتتاح/الإغلاق (O/X)
✅ الطباعة المفردة ومستويات POC/VA العارية
✅ تراكب OHLC لليوم واليوم السابق
✅ تراكب OHLC لليوم واليوم السابق
✅ إسقاط شريط HTF (AMD)
تحسينات رئيسية
✔ تحميل أسرع
✔ إدارة أفضل للذاكرة
✔ حساب دقيق لمنطقة القيمة
✔ تحديد موضع صحيح لملف الجلسة
✔ أداء أفضل للتبديل
✔ توافق عبر المنصات
✔ جلسات تعتمد على UTC (بدون التوقيت الصيفي التلقائي)
✔ تحسين التعامل مع POC العارية
✔ تحسين عرض الملف
🧭 حالات استخدام التداول
🔹 تحليل مزاد داخل اليوم — تحديد مكان تكوين القيمة أو انتقالها أو كسرها.
🔹 صفقات عودة POC والقيمة — استهداف إعادة اختبار التوازن أو تلاشي الأطراف.
🔹 اختراقات التوازن الأولي — اكتشاف متى تتوسع الجلسة خارج نطاق الساعة الأولى.
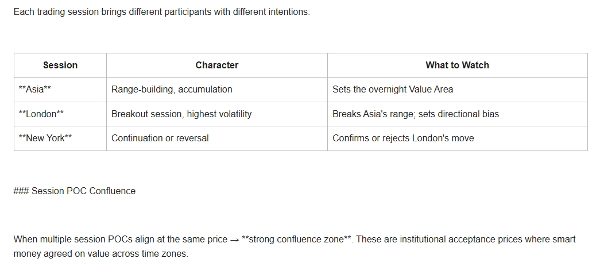
🔹 دراسة دوران الجلسة — مقارنة الملفات عبر جلسات آسيا ولندن ونيويورك مع محاذاة المناطق الزمنية.
🔹 بناء السياق المؤسسي — الجمع مع أدوات الحجم أو الدلتا للتحقق من بصمات الأموال الذكية.
أنواع الملفات
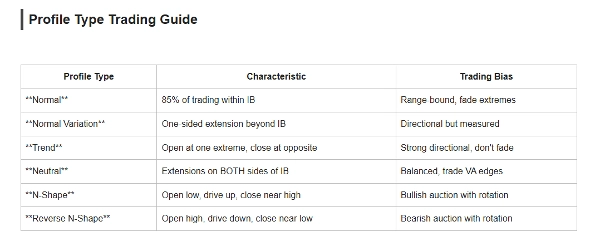
نوع حالة السوق
عادي سوق متوازن
تغير عادي اتجاه معتدل
اتجاه يومي قوي موجه
مزاد محايد ذو جانبين
مزاد صاعد على شكل N
مزاد هابط عكسي على شكل N
مثالي لـ
- نظرية سوق المزاد (AMT)
- متداولو ملف السوق
- المتداولون داخل اليوم
- متداولو التأرجح
- متداولو العقود الآجلة
- متداولو الفوركس
- تحليل تدفق الأوامر المحترف
اجلب الوضوح المؤسسي إلى مخططاتك.
يقوم مؤشر ملف السوق TPO بتحويل بيانات السعر الخام إلى قصة عن القيمة، والاختلال، والفرصة
إخلاء المسؤولية: هذا المؤشر مقدم لأغراض تعليمية ومعلوماتية فقط ولا يشكل نصيحة مالية أو استثمارية أو تداولية. ملف السوق هو أداة تحليلية ولا يضمن الأرباح أو النتائج المستقبلية.
ينطوي تداول الأسواق المالية على مخاطر كبيرة، ولا يضمن الأداء السابق النتائج المستقبلية. المستخدمون هم المسؤولون الوحيدون عن قرارات التداول الخاصة بهم، وإدارة المخاطر، وأي أرباح أو خسائر ناتجة.
قم دائمًا بإجراء تحليلك الخاص واستشر محترف مالي مؤهل قبل اتخاذ قرارات الاستثمار أو التداول.
الملخص
Key features include multiple TPO display modes (letters and histogram), session and timezone intelligence with UTC-based sessions, open/close price markers (O/X), single prints, naked POC/VA levels, and overlays of day and previous day OHLC data. The indicator supports analysis of various market conditions through profile types like Normal (balanced market), Normal Variation (moderate trend), Trend (strong directional day), Neutral (two-sided auction), N-Shape (bullish auction), and Reverse N-Shape (bearish auction).
It is suitable for professional day traders, auction market analysts, order flow enthusiasts, and traders across Forex, indices, and commodities markets. Typical use cases include intraday auction analysis, POC and value reversion trades, initial balance breakouts, session rotation studies, and institutional context building when combined with volume or delta tools.
This indicator provides a detailed, structured view of market dynamics to support informed trading decisions based on Auction Market Theory and Market Profile principles.
تقييمات العملاء
5 | 0 % | |
4 | 100 % | |
3 | 0 % | |
2 | 0 % | |
1 | 0 % |


![شعار "High-Low Divergence [Iridio Capital]"](https://cdn.ctrader.com/image/webp/443c4661-7abb-40f1-842f-4b6ec560649b_40914)


