شعار "Trend Heikin Multi MA"
مؤشر
5 عمليات الشراء
الإصدار 1.0، Apr 2025
Windows, Mac
4.3
التقييمات: 3
صورة "Trend Heikin Multi MA" المحملة
منذ 03/10/2024
159
المبيعات
36.57K
التثبيتات المجانية

📊 TrendHeikinMultiMA – خوارزمية الاتجاه المتقدمة

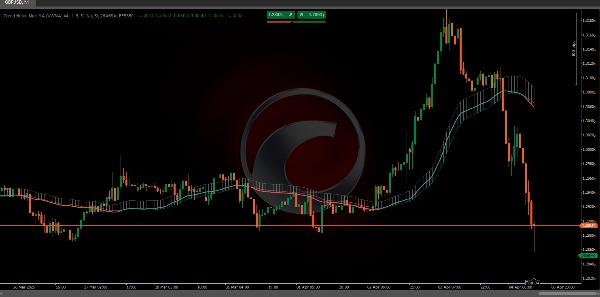
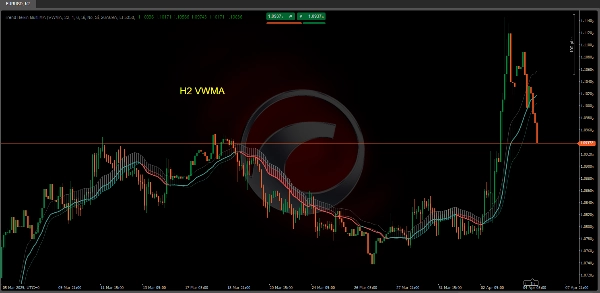
الخوارزمية TrendHeikinMultiMA مصممة لحساب قيم الاتجاه من بيانات السعر، باستخدام صيغة Heikin-Ashi لتنعيم هذه القيم وتطبيق أنواع مختلفة من المتوسطات المتحركة (ALMA, HMA, SMA, SWMA, VWMA, WMA, ZLEMA, أو EMA).

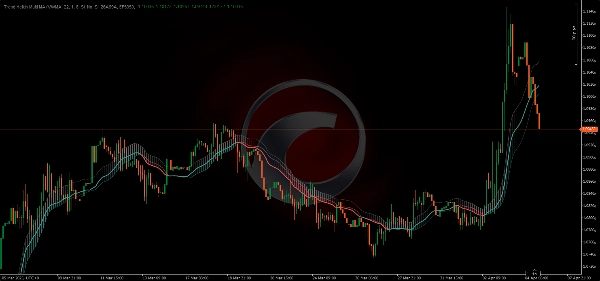
على الرغم من أن قيم Heikin-Ashi تُستخدم داخليًا، إلا أن الرسم البياني لا يعرض شموع Heikin-Ashi التقليدية. بدلاً من ذلك، يرسم خطوط الاتجاه بناءً على القيم الملساء، مما يجعل اتجاه السوق أسهل في التفسير دون التعقيد البصري لرسوم الشموع.


🔄 1. دور التنعيم

نظرًا لأن قيم الاتجاه مشتقة من تنعيم Heikin-Ashi مع متوسط متحرك، فإن تغيير اللون في TrendHeikinMultiMA لا يحدث فورًا عندما يعبر السعر خط الاتجاه:

  • 🔹 قد يتحرك السعر مؤقتًا فوق أو تحت خط الاتجاه دون تحفيز تغيير اللون.
  • 🔹 يحدث هذا لأن المؤشر ينتظر فرقًا كبيرًا ومستمرًا بين قيم الفتح والإغلاق الملساء لتأكيد انعكاس الاتجاه الفعلي.

ميزة في التفسير

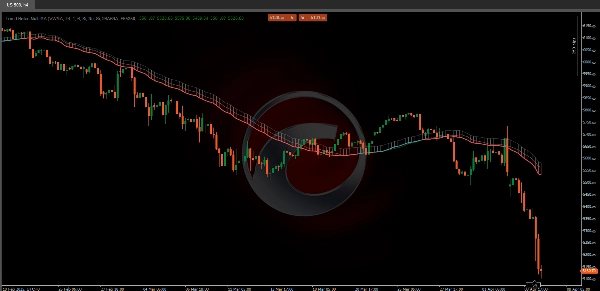
هذا التأخير المتعمد في تغيير اللون يساعد على تجنب الإشارات الخاطئة. في رسم الشموع التقليدي، قد يعبر السعر خط الاتجاه لفترة وجيزة ويحفز إشارات مبكرة.

  • 🟥 على سبيل المثال، حتى إذا كان السعر الحالي فوق خط اتجاه هابط، سيظل المؤشر أحمر (هابط) حتى تؤكد القيم الملساء أن الإغلاق أعلى من الفتح باستمرار.
  • 🟩 بالمثل، للتبديل إلى الأخضر (صاعد)، يجب أن يؤكد المتوسط المتحرك المستند إلى Heikin-Ashi أن الإغلاق يتجاوز الفتح باستمرار.


📈 2. تطبيق المتوسطات المتحركة على قيم Heikin-Ashi

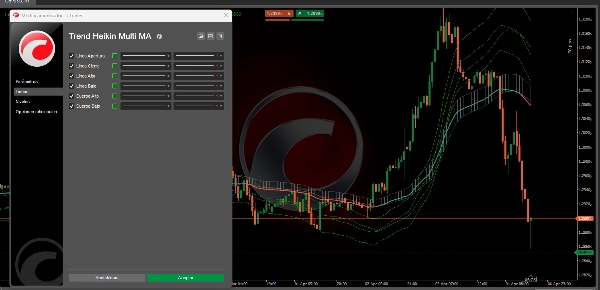
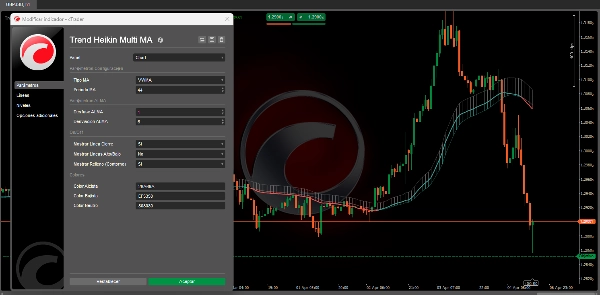
  • 🔄 اختيار المتوسط المتحرك:
    • يمكن للمستخدم الاختيار بين أنواع مختلفة من المتوسطات المتحركة (ALMA, HMA, SMA, SWMA, VWMA, WMA, ZLEMA, و EMA).
    • كل نوع من المتوسطات المتحركة يطبق طريقة رياضية محددة لوزن وتنعيم القيم التاريخية لـ الفتح، الإغلاق، الأعلى، والأدنى المستمدة من Heikin-Ashi.


🏆 3. مزايا استخدام TrendHeikinMultiMA مقابل الشموع التقليدية
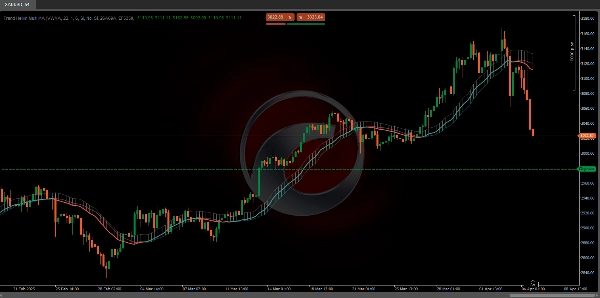
  • 📉 تقليل الضوضاء:
    • غالبًا ما تعرض الشموع التقليدية تقلبًا عاليًا وبيانات متفرقة، مما يصعب تحديد الاتجاه العام.
    • TrendHeikinMultiMA يقوم بتنعيم هذه البيانات، مع تصفية التقلبات الطفيفة والقضاء على التقلبات الحادة، مما يسمح للمتداولين بالتركيز على الاتجاه الأساسي للسوق.


الخلاصة

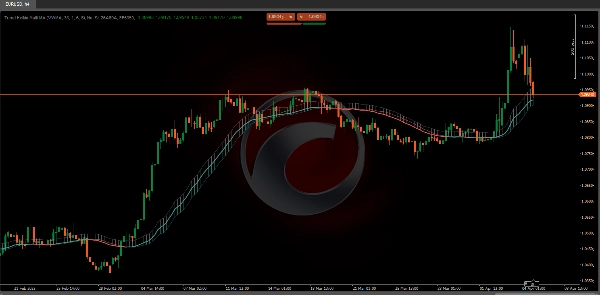
باختصار، TrendHeikinMultiMA يؤكد تغيير الاتجاه (صاعد أو هابط) فقط عندما قيم الفتح والإغلاق الملساء—المحسوبة من Heikin-Ashi والمعالجة عبر المتوسط المتحرك المختارتظهر باستمرار أن سلوك السوق قد عكس اتجاهه.

هذا يضمن أن الإشارات أكثر موثوقية وأقل تأثرًا بالضوضاء التي تظهر في رسوم الشموع التقليدية. 🚀📊


🔥 مؤشرات متجر Pinescritlabs Ctrader 🔥 

جلسات فجوة القيمة العادلة

زيج زاج

 BOS & CHOCH

نظام اختراق القناة

سوبرتريند

اختلال السوق

قناة الاتجاه التكيفية 

هيكل السوق الديناميكي
تحليل نقاط الانعطاف

كتلة الأوامر

انحدار فيبوناتشي الخطي
تعدد الأطر الزمنية

خريطة حرارة حجم POC

مؤشر RSI الديناميكي

فجوة القيمة العادلة للحركة

توقع تدفق السوق

تدرج الاتجاه الديناميكي

انحياز الشمعة متعدد المستويات
المتعقب

متعقب زيج-زاج المتطرف

المتوسط المتحرك التفاعلي

قناة الاتجاه التلقائية

دعم ومقاومة تلقائية
خطوط الاتجاه

جميع مستويات الدعم و
المقاومة

خريطة تصفية الرافعة المالية

مناطق العرض والطلب

زخم النطاق الديناميكي


ملف تعريف المؤشر
4.3
التقييمات: 3
5
33 %
4
67 %
3
0 %
2
0 %
1
0 %
تقييمات العملاء
April 7, 2025
Useful plan helper around moving average setups. The useful part is checking direction and filtered momentum, with the numbers checked before scaling. I would compare 10, 20 and 50 MA behavior before using it with real size. The signal is clearer when the stop and target still give at least 1.5R.
April 6, 2025
April 6, 2025
Careful market layer if the trader wants it makes trend and smoothing logic easier to follow. It works best as support, not a final decision maker. The MA read feels better when 20 and 50 period context agree across 2 timeframes. MAs can lag when price turns fast.
Breakout
Supertrend
RSI
يتم توفير المنتجات المتاحة من خلال cTrader Store، بما في ذلك روبوتات التداول والمؤشرات والإضافات، من قبل مطوري الطرف الثالث وإتاحتها لأغراض الوصول المعلوماتي والفني فقط. cTrader Store ليس وسيطًا ولا يقدم نصائح استثمارية أو توصيات شخصية أو أي ضمان للأداء المستقبلي.

المزيد من هذا المؤلف

شعار "ZigZag"
الأعلى تقييمًا
4.3
(6)
مجاني
مؤشر
ATR
RSI
+7
ZigZag filters noise, spots trends, patterns, pivots, aiding analysis, trade management, and confirmations. 📉📈
مؤشر
ATR
RSI
+7
Identify bullish and bearish Order Blocks to spot key support/resistance levels and potential trend reversals! 📈🔄
شعار "Volume POC Heatmap"
الأعلى تقييمًا
5.0
(4)
مجاني
مؤشر
ATR
RSI
+7
📊 Shows volume by price levels, highlights POC, and key zones. Identifies dynamic support/resistance and imbalances.
مؤشر
ATR
RSI
+6
Market structural patterns , specifically the concepts of Change of Character (ChoCH) 🔄 and Break of Structure (BoS) 💥
شعار "Auto-Trend Channel"
الأعلى تقييمًا
4.4
(5)
مجاني
مؤشر
ATR
RSI
+6
Adaptive trend channel using linear regression and Pearson correlation for dynamic support, resistance, and trends.
مؤشر
RSI
Breakout
+1
"Identify key market zones and visualize support/resistance from multiple timeframes on a single chart.
شعار "Fair Value Gap Sessions"
الأعلى تقييمًا
5.0
(4)
مجاني
مؤشر
ATR
RSI
+7
identify and highlight temporary market inefficiencies known as "fair value gaps" 🚨 within specific trading Sessions.
مؤشر
ATR
RSI
+6
💹 Define a price channel 📈 and determine trend direction (bullish 🟢 or bearish 🔴).
مؤشر
ATR
RSI
+6
📊Zones Supply & Demand: Identifies key price levels with high volume concentration, marking Supply/Demand Zones & Marke
مؤشر
RSI
BTCUSD
+5
Identify market structure effortlessly with swing highs, lows, CHoCH, and BOS levels for smart trading decisions! 📊🔍"
مؤشر
ATR
RSI
+8
Detects bullish and bearish divergences
مؤشر
Advanced price action tool that combines multiple technical analysis concepts

قد يعجبك أيضًا

مؤشر
Advanced customizable volume-profile indicator with buy/sell levels, delta analysis, multi-TF support and vivid gradient
مؤشر
ATR
RSI
+6
💹 Define a price channel 📈 and determine trend direction (bullish 🟢 or bearish 🔴).
مؤشر
Imbalance
Key Levels
+4
This indicator combines Multi-Timeframe Liquidity tracking, a dynamic Fair Value Gap (FVG) and a 50% Daily Range
مؤشر
MCDX is a powerful and innovative indicator.
مؤشر
Prop
Forex
+13
Volume Meter
مؤشر
Forex
EURUSD
+5
Fimathe Indicator - Fimathe PCM - Automated Trend Channels & Levels — Ideal for live trading and backteting
مؤشر
MultiTF Pivot and SR Indicator
مؤشر
Supply & Demand
Support & Resistance
RAF Supply Demand Lite v1.0 automatically detects clean Supply and Demand zones using confirmed swing highs and lows. Zo
مؤشر
ATR
EMA
+3
The UTBot you know from TradingView — now on cTrader with confirmed signals, VWAP, EMA and session overlays.
مؤشر
EMA
SMA
+3
MACD indicator modeled after TradingView, featuring a 4-color momentum histogram, sound/pop-up crossover alerts.
مؤشر
Forex
BTCUSD
+11
Unlock trading precision with QQE! Dual QQE indicators with a Bollinger Bands zero line provide clear buy/sell signals.
مؤشر
AI
ATR
+9
Index Hunter: Momentum analysis for US30 & NAS100. Designed to identify high-velocity moves and intraday trends.
مؤشر
Key Levels
Supply & Demand
+2
Institutional Levels Pro is an essential tool for traders who rely on price action and institutional market structure.
مؤشر
Forex
Real-Time Candlestick Pattern Detection with Custom Alerts & Trend Analysis for cTrader
مؤشر
AI
Forex
+7
Signal Strike is a professional trading indicator delivers clear, high‑confidence entry signals directly on your chart
مؤشر
AI
SMC
+9
Identifies market trends (-10 to +10) using HMA with volume confirmation. Includes customizable alerts.
مؤشر
AI
Grid
+17
Clean 3D, Sleek Candles for Trend Patterns.
مؤشر
BOS
MSS
+5
WinSMC is an overlay SMC indicator for cTrader. It helps you visually identify!
منذ 03/10/2024
159
المبيعات
36.57K
التثبيتات المجانية