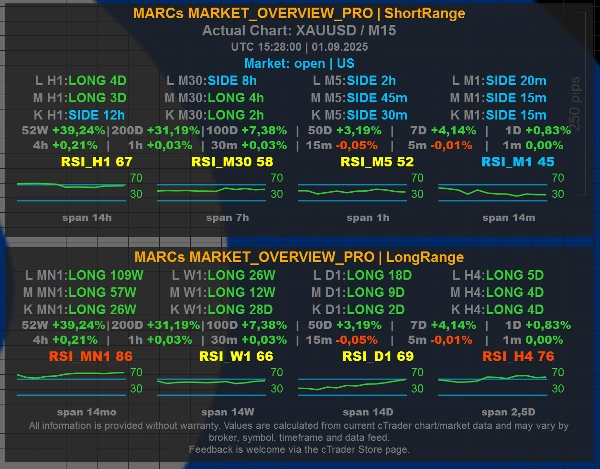
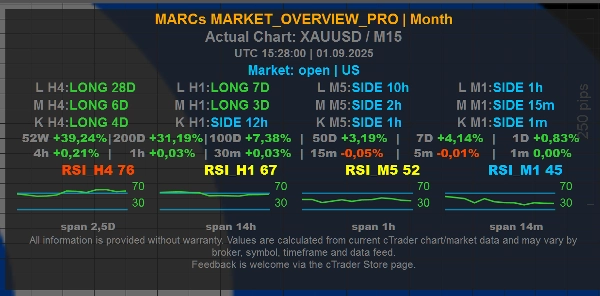
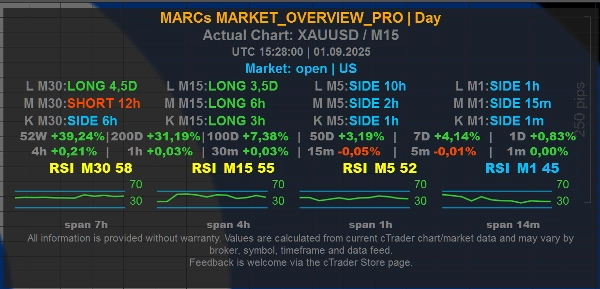
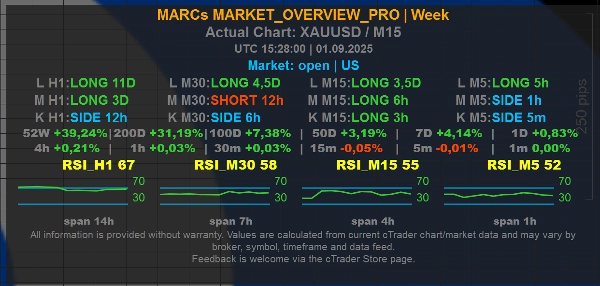
present
Sign up and get $50 off your first purchase
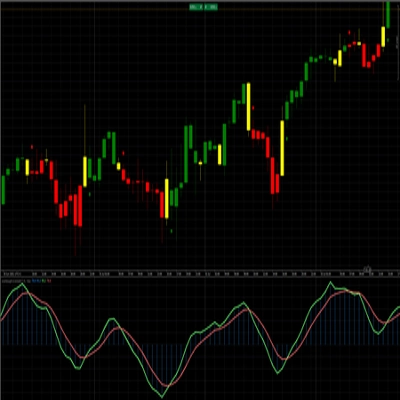
Trading product for MARCs_MARKET_OVERVIEW_PRO Indicator Key Levels RSI, image 1
MARCs_MARKET_OVERVIEW_PRO
Indicator
Version 1.1, Aug 2026
Windows, Mac
Trading product for MARCs_MARKET_OVERVIEW_PRO Indicator Key Levels RSI, image 2
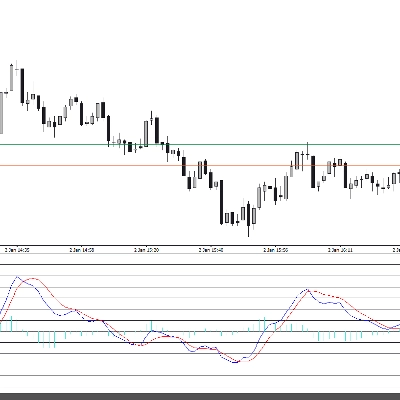
Trading product for MARCs_MARKET_OVERVIEW_PRO Indicator Key Levels RSI, image 3
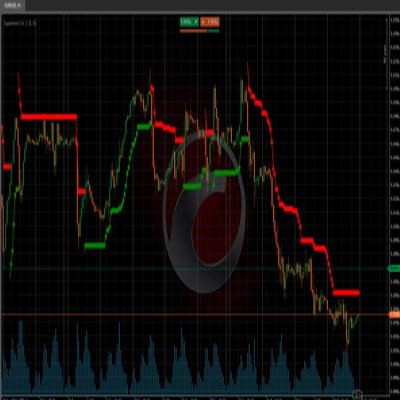
Trading product for MARCs_MARKET_OVERVIEW_PRO Indicator Key Levels RSI, image 4
Trading product for MARCs_MARKET_OVERVIEW_PRO Indicator Key Levels RSI, image 5
Trading product for MARCs_MARKET_OVERVIEW_PRO Indicator Key Levels RSI, image 6
Trading product for MARCs_MARKET_OVERVIEW_PRO Indicator Key Levels RSI, image 7
Trading product for MARCs_MARKET_OVERVIEW_PRO Indicator Key Levels RSI, image 8
Trading product for MARCs_MARKET_OVERVIEW_PRO Indicator Key Levels RSI, image 9
Trading product for MARCs_MARKET_OVERVIEW_PRO Indicator Key Levels RSI, image 10
Since 24/06/2026
29
Free installs

Description

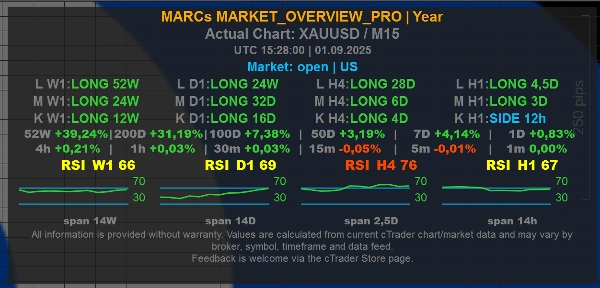
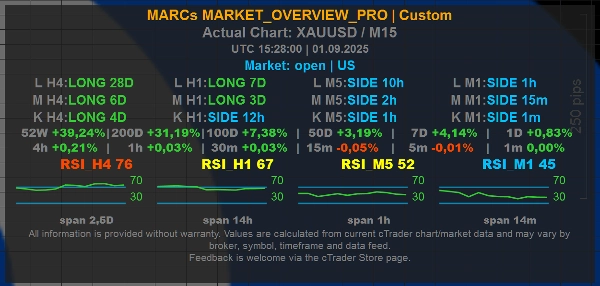
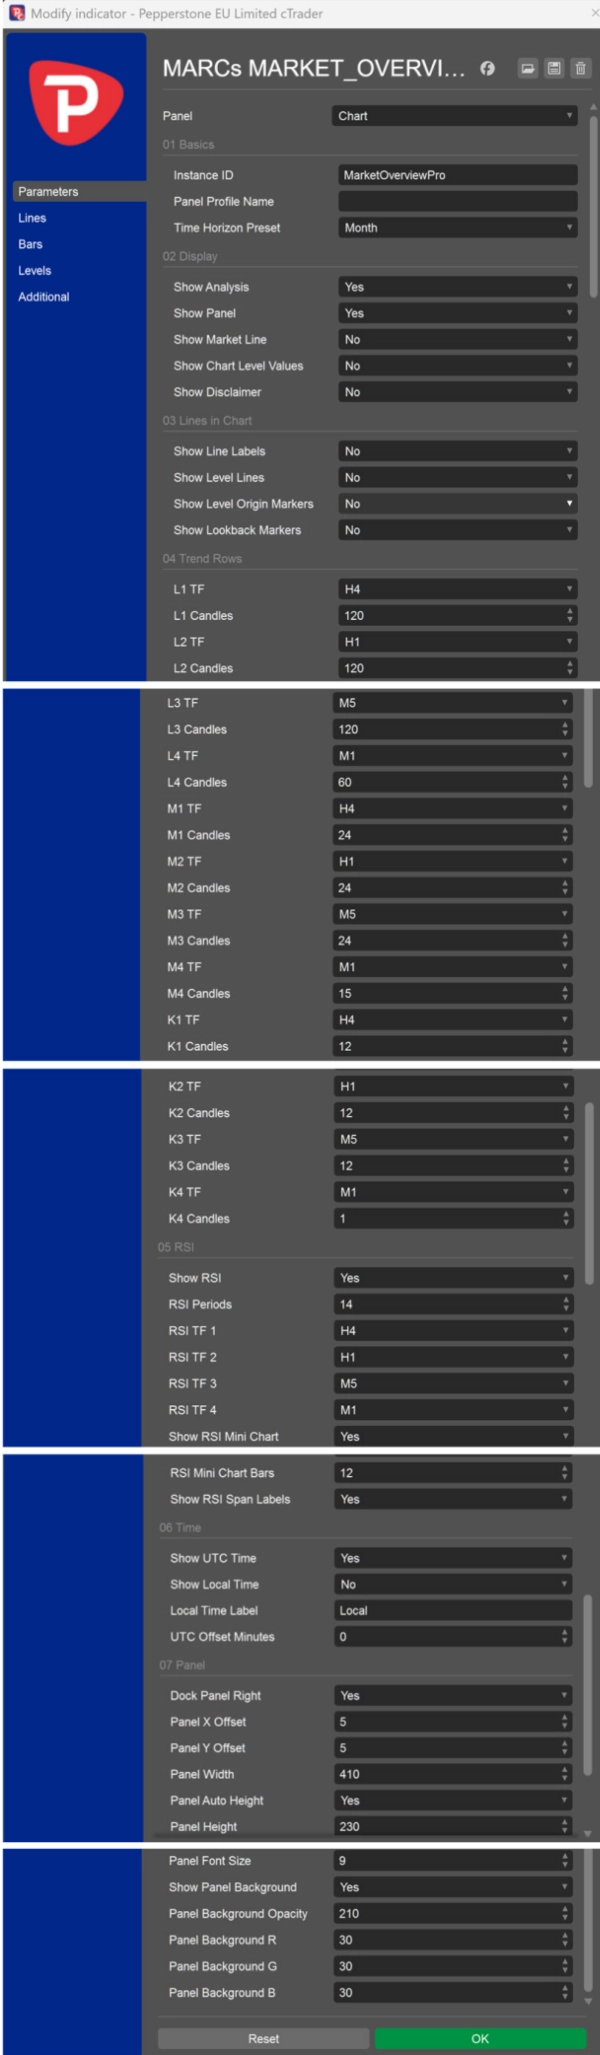
MARCs MARKET_OVERVIEW_Pro is a multi-timeframe market overview indicator for cTrader.


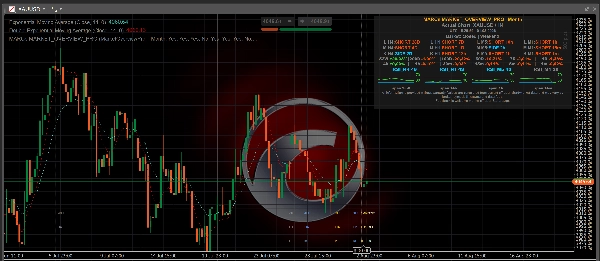
It displays a compact on-chart dashboard with trend context, RSI readings, market/session information and configurable time-horizon presets. The indicator was originally developed around XAUUSD / Gold analysis, but is designed to work as a general market overview tool on any available chart symbol, depending on broker data quality and available market history.


Main features:

- Multi-timeframe trend rows for short, medium and long market context

- Configurable Day, Week, Month, Year, ShortRange, LongRange and Custom presets

- RSI values and mini RSI charts across selected timeframes

- Optional UTC and local time display

- Optional market/session line

- Optional chart-level reference lines

- Optional chart-level values shown directly in the panel


Level Lines and Chart Level Values:

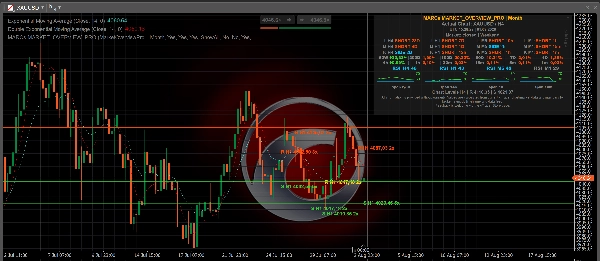
The optional Show Level Lines setting can display calculated chart reference levels from one selected timeframe: M1, M5, M15, M30, H1, H4, D1, W1 or MN1. For these individual timeframe selections, the indicator shows the nearest calculated resistance above the current price and the nearest calculated support below the current price. ShowAll displays the broader H1 level set from the existing H1 level calculation. No keeps level lines hidden.


The optional Show Chart Level Values setting can show the same nearest resistance/support reference values directly in the panel without drawing lines on the chart. The panel line is labelled, for example, "Chart Levels H1 | R ... | S ..." to make clear that the values refer to chart-level references.


How Level Lines are calculated:

The levels are derived from past swing highs and swing lows in the selected timeframe. Nearby swing points are grouped into level clusters, and only areas with enough repeated touches are shown. This makes the lines visual market-context markers based on available chart history.


Important:

MARCs Market Overview Pro is an analysis-only market overview tool. It does not place trades, manage positions, provide investment advice or guarantee trading results.


Level Lines are not buy signals, sell signals, stop-loss recommendations, take-profit recommendations or investment advice. They do not predict that price will reverse, break out or react at a specific level.


All readings depend on the available cTrader chart data, broker symbol feed, timeframe and market history. Values may differ between brokers, symbols and data feeds.


Trading involves risk. Past performance does not guarantee future results.


TRANSPARENCY NOTE

This indicator was developed with the assistance of AI-based tools.

Summary

AI summary
MARCs MARKET_OVERVIEW_Pro is a multi-timeframe market overview indicator designed for the cTrader platform. It provides a compact on-chart dashboard that displays trend context across short, medium, and long timeframes, RSI values with mini RSI charts, and market/session information. Users can configure time-horizon presets including Day, Week, Month, Year, ShortRange, LongRange, and Custom settings.

The indicator supports optional display of UTC and local times, market/session lines, and chart-level reference lines. These reference lines represent calculated support and resistance levels derived from clusters of past swing highs and lows on selected timeframes ranging from 1 minute to monthly intervals. Users can choose to show these levels as lines on the chart or as numeric values within the dashboard panel.

Originally developed with a focus on XAUUSD (Gold), MARCs MARKET_OVERVIEW_Pro is adaptable to any chart symbol supported by the brokerโ€™s data feed and market history. It serves as an analysis tool providing visual market structure and momentum insights but does not execute trades or offer trading advice. The indicatorโ€™s readings depend on the quality and availability of broker data and chart history.
Indicator profile
Indicator category
Market structure (SMC)
Output type
Visualisation
Filter
Data requirements
Bars only
Supported signals
Trend strength
Level touch

Customer reviews

0.0
Reviews: 0
Customer reviews
No reviews for this product yet. Already tried it? Be the first to tell others!

Discussion

FAQ

Key Levels
RSI
Market Structure
Risk Dashboard
Support & Resistance
Products available through cTrader Store, including trading bots, indicators and plugins, are provided by third-party developers and made available for informational and technical access purposes only. cTrader Store is not a broker and does not provide investment advice, personal recommendations or any guarantee of future performance.

More from this author
Indicator
RSI
Key Levels
+3
MARCs Free XAUUSD market overview dashboard with trend rows, RSI context, sessions and fixed Day/Month presets.

You may also like

Indicator
AI
ATR
+27
Overbought Oversold Indicator
"macdZR" logo
Top-rated
4.6
(5)
$19
Indicator
MACD
Forex
+5
MACD ZERO LAG. Get faster signals, earlier trend detection, and eliminate the delay of traditional moving averages
Indicator
AI
Signal
+1
๐Ÿ”ฅ THIS BURNS JP225 INDICATOR โ€“ Professional Trading Signals
Indicator
Doji
Volume
+5
Instantly spot high-liquidity institutional moves with clean, non-obtrusive triangle alerts on cTrader charts.
Indicator
Visually master the Inside Bar strategy with clear breakout signals and professional chart highlighting ๐Ÿ“ˆ๐Ÿ””๐Ÿ“‰
Indicator
BOS
MSS
+5
Your entire ICT session map, structure engine, and key levels โ€” No manual work. One indicator. Every session!
Indicator
ATR
RSI
+6
๐Ÿ’น Define a price channel ๐Ÿ“ˆ and determine trend direction (bullish ๐ŸŸข or bearish ๐Ÿ”ด).
Indicator
Prop
Forex
+11
๐ŸŒŠ See when the market is truly in play. Tsunami measures Relative Volume by time-of-day ๐ŸŒŠ
Indicator
Fisher Transform with smoothing. Spot reversals and cycles with precision. Great for any market, any timeframe.
Indicator
[Hamster-Coder] Pivot Points (Multi Time Frame)
Indicator
ATR
RSI
+9
๐Ÿš€ MACARX Indicator - The Multi-Indicator Trend Fusion ๐Ÿš€
Indicator
Volume
Key Levels
+5
Volume Profile Pro - A Lightweight and Highly Customizable Side & Range Volume Profile
Indicator
AI
ATR
+27
VolumeProfileSuite is an advanced and flexible Volume Profile indicator for cTrader.
Indicator
ADX
ATR
+1
Indicador de Sinais Visuais para Spotcrude (WTI) ou SpotBrent com filtros de tendรชncia, operacional de 10 e 15 minutos.
Indicator
RSI
Stochastic
+2
Composite mean-reversion oscillator merging Z-Score, RSI & Bollinger %B into one clear overbought/oversold signal.
Indicator
AI
Prop
+14
Professional Trading Indicator Transform Your Trading with Intelligent Signal Detection RenkoProfit
Indicator
ATR
Prop
+14
Optimize exits with Chandelier Exit! Visualize stop-loss points dynamically for improved trading precision and safety.
Indicator
Supertrend
Moving Average
Adaptive MA anchored to structural trend changes โ€” no fixed period. Dual Supertrend + swing detection.

Price

Since 24/06/2026
29
Free installs