
CCI - With Arrows and 40 80 EMA Logic_noSourceCode
Chỉ báo
2 lượt mua
Phiên bản 1.0, Feb 2025
Windows, Mac
5.0
Đánh giá: 1
Mô tả
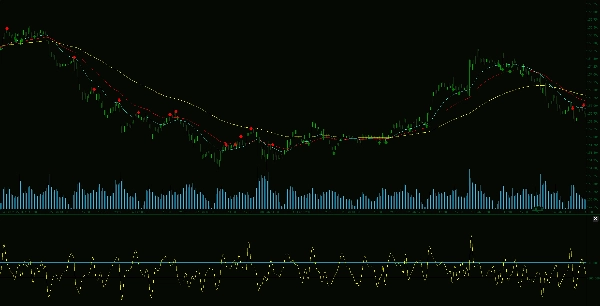
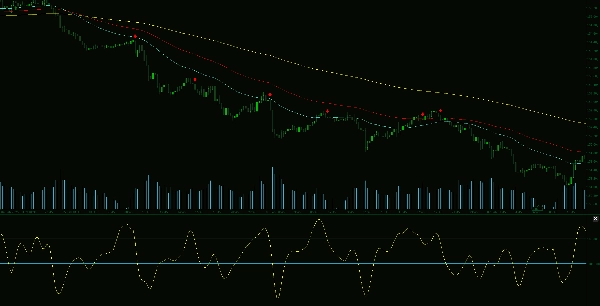
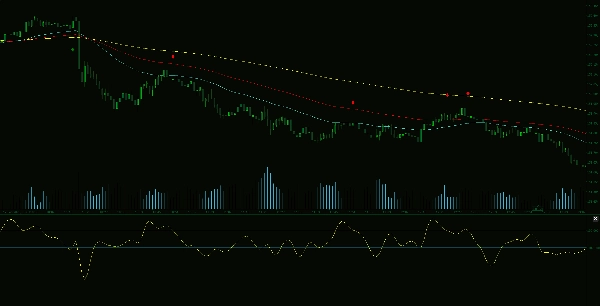
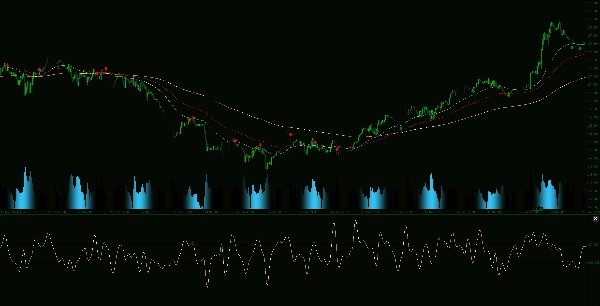
Chỉ báo Advanced CCI & EMA là một công cụ giao dịch mạnh mẽ nâng cao phân tích xu hướng bằng cách kết hợp Chỉ số Kênh Hàng hóa (CCI) với logic EMA 40 và 80. Phương pháp tinh vi này tạo ra các mũi tên chỉ ra khả năng di chuyển giá, giúp các nhà giao dịch xác định các cơ hội giao dịch có xác suất cao.
Các tính năng chính:
Tóm tắt
Tóm tắt AI
The Advanced CCI & EMA Indicator integrates the Commodity Channel Index (CCI) with 40 and 80-period Exponential Moving Averages (EMAs) to enhance trend analysis and momentum detection. It generates clear buy and sell arrows on the chart, signaling potential price movements based on combined momentum and trend confirmation. Key features include CCI-based identification of overbought and oversold conditions, EMA logic to confirm trend direction and filter weak signals, and customizable settings to adapt to various trading strategies and timeframes. This indicator supports traders in aligning with prevailing market trends and improving timing by reducing false reversal signals. It is suitable for use on indices and commodities markets.
Hồ sơ chỉ báo
Đánh giá của khách hàng
5.0
Đánh giá: 1
5 | 100 % | |
4 | 0 % | |
3 | 0 % | |
2 | 0 % | |
1 | 0 % |
Đánh giá của khách hàng
February 25, 2025
half size is enough at the start. Low quality setups lose some appeal.
Thảo luận
Câu hỏi thường gặp
Indices
Commodities
Các sản phẩm có sẵn trên cTrader Store, bao gồm bot giao dịch, chỉ báo và plugin, được cung cấp bởi các nhà phát triển bên thứ ba và chỉ nhằm mục đích cung cấp thông tin và tiếp cận kỹ thuật. cTrader Store không phải là nhà môi giới và không cung cấp lời khuyên đầu tư, khuyến nghị cá nhân hay bất kỳ đảm bảo nào về hiệu suất trong tương lai.


Giá
Kể từ 14/01/2025
55
Lượt bán
11.44K
Cài đặt miễn phí