
Mô tả
https://chartshots.spotware.com/c/695be69b1a3ca
https://chartshots.spotware.com/c/695be2a98e848
https://chartshots.spotware.com/c/695be7e8e88fa
https://chartshots.spotware.com/c/695be31346fe7
https://chartshots.spotware.com/c/695be3bd18aea
https://chartshots.spotware.com/c/695be5d5687c7
Mẫu Biểu Đồ Tự Động
📊 NÓ LÀ GÌ?
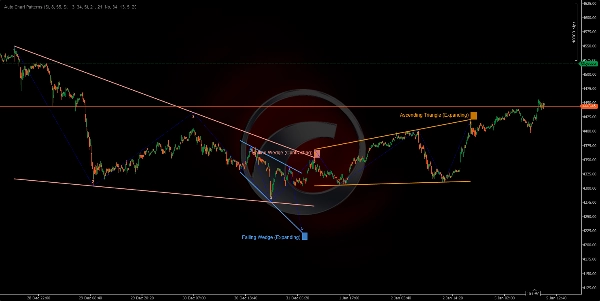
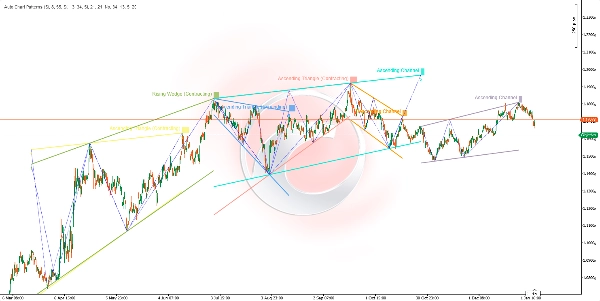
Chỉ báo Mẫu Biểu Đồ Tự Động là một bộ quét hình học tiên tiến tự động phát hiện và trực quan hóa các mẫu biểu đồ cổ điển bằng cách sử dụng phân tích điểm dao động đa khung thời gian. Nó xác định 14 dạng hình học khác nhau bao gồm các kênh, nêm và tam giác bằng cách kết nối các đỉnh và đáy dao động với các đường xu hướng, tạo thành một hệ thống nhận dạng mẫu toàn diện.
🎯 NÓ DÙNG ĐỂ LÀM GÌ?
Chỉ báo này giúp các nhà giao dịch:
- Tự động phát hiện 14 mẫu biểu đồ cổ điển (kênh, nêm, tam giác) 📐
- Xác định các vùng phá vỡ tiềm năng trước khi chúng xảy ra ⚡
- Trực quan hóa cấu trúc thị trường thông qua các mối quan hệ giá hình học 🔍
- Giao dịch các mẫu tiếp diễn và đảo chiều với xác nhận trực quan ✅
- Lọc các mẫu theo hướng xu hướng và loại điểm pivot cuối cùng 🎛️
- Phân tích nhiều khung thời gian dao động cùng lúc để tìm sự đồng thuận 🌊
🔍 NÓ HOẠT ĐỘNG NHƯ THẾ NÀO?
Hệ Thống Phát Hiện Điểm Dao Động 📍
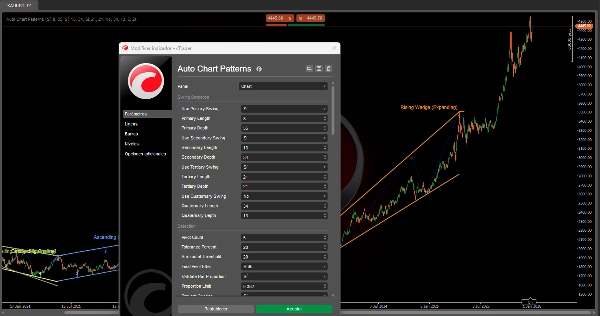
Chỉ báo sử dụng tới bốn bộ phát hiện dao động độc lập chạy đồng thời, mỗi bộ có thể điều chỉnh độ nhạy:
- Logic Phát Hiện:
-
- Theo dõi các đỉnh và đáy giá trong một cửa sổ lăn (Period).
- Xác định các đỉnh cục bộ (điểm cao dao động) và đáy cục bộ (điểm thấp dao động).
- Xác nhận dao động chỉ sau khi đạt yêu cầu độ sâu tối thiểu (ngăn nhiễu).
- Đỉnh Dao Động: Giá tạo đỉnh cao nhất trong Period, sau đó giảm trong
MinDepththanh. - Đáy Dao Động: Giá tạo đáy thấp nhất trong Period, sau đó tăng trong
MinDepththanh.
- Bốn Lớp Dao Động:
-
- Dao Động Chính (Mặc định: Độ dài 8, Độ sâu 55) - Cấu trúc dài hạn 🔵
- Dao Động Phụ (Mặc định: Độ dài 13, Độ sâu 34) - Cấu trúc trung hạn 🟢
- Dao Động Ba (Mặc định: Độ dài 21, Độ sâu 21) - Cấu trúc ngắn hạn 🟡
- Dao Động Bốn (Mặc định: Tắt) - Khung thời gian tùy chỉnh 🟣
Mỗi bộ phát hiện có thể được bật/tắt độc lập để tập trung vào các cấu trúc thị trường cụ thể.
Quá Trình Hình Thành Mẫu 🎨
BƯỚC 1 - THU THẬP PIVOT:
- Hệ thống thu thập 5 hoặc 6 điểm dao động gần nhất từ bất kỳ bộ phát hiện nào đang hoạt động.
- Các điểm phải xen kẽ giữa đỉnh và đáy (cấu trúc zigzag).
- Ví dụ 5 điểm: Đỉnh → Đáy → Đỉnh → Đáy → Đỉnh.
BƯỚC 2 - XÂY DỰNG ĐƯỜNG XU HƯỚNG:
- Phân tách các pivot thành điểm trên (đỉnh dao động) và điểm dưới (đáy dao động).
- Vẽ hai đường xu hướng: biên trên và biên dưới.
- Đối với biên 3 điểm: Kiểm tra 3 kết hợp (0-2, 0-1, 1-2) và chọn kết quả phù hợp nhất ⭐
- Xác nhận rằng các đường xu hướng không xuyên qua thân nến (chỉ cho phép phần bóng).
- Tính điểm phù hợp: các đường phải chạm < 20% số thanh giữa các pivot.
BƯỚC 3 - PHÂN TÍCH HÌNH HỌC:
- Đo mối quan hệ góc giữa biên trên và biên dưới.
- Xác định xem hình thành là Mở Rộng (mở rộng), Co Lại (thu hẹp), hoặc Song Song (độ rộng không đổi).
- Xác định hướng xu hướng: Tăng, Giảm, hoặc Trung Tính (ngang).
- Phân loại thành một trong 14 loại hình thành dựa trên hình học.
BƯỚC 4 - XÁC NHẬN & LỌC:
- Kiểm Tra Tỷ Lệ Thanh: Đảm bảo khoảng cách dao động tỷ lệ (ngăn mẫu bị biến dạng) ✅
- Ngăn Chặn Chồng Lấp: Chặn các mẫu mới xung đột với mẫu hiện có 🚫
- Kiểm Tra Trùng Lặp: Ngăn vẽ lại cùng một mẫu.
- Bộ Lọc Pivot Cuối: Chỉ hiển thị các mẫu kết thúc với hướng pivot được chỉ định (Lên/Xuống/Cả hai).
- Bộ Lọc Loại Hình Thành: Bật/tắt các loại mẫu cụ thể.
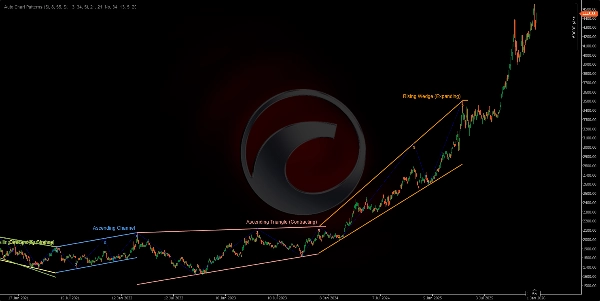
BƯỚC 5 - TRỰC QUAN HÓA:
- Vẽ các đường biên trên và dưới với màu sắc sống động từ bảng màu 12 màu 🎨
- Tùy chọn hiển thị các đường dao động zigzag nối các pivot (màu xanh chấm).
- Hiển thị số pivot (1, 2, 3, 4, 5) tại mỗi điểm dao động.
- Gắn nhãn hình thành với tên mẫu tại pivot cuối cùng.
- Mã màu nền phía sau nhãn để rõ ràng hơn.
📐 14 HÌNH THÀNH ĐƯỢC PHÁT HIỆN
KÊNH (Hình Thức Song Song) 📦
- Kênh Tăng Dần (Song song hướng lên) 📈
-
- Cả hai biên đều nghiêng lên với góc độ tương tự.
- Chỉ báo xu hướng tiếp diễn tăng giá.
- Giao dịch: Mua tại biên dưới, bán tại biên trên.
- Kênh Giảm Dần (Song song hướng xuống) 📉
-
- Cả hai biên đều nghiêng xuống với góc độ tương tự.
- Chỉ báo xu hướng tiếp diễn giảm giá.
- Giao dịch: Bán tại biên trên, mua tại biên dưới.
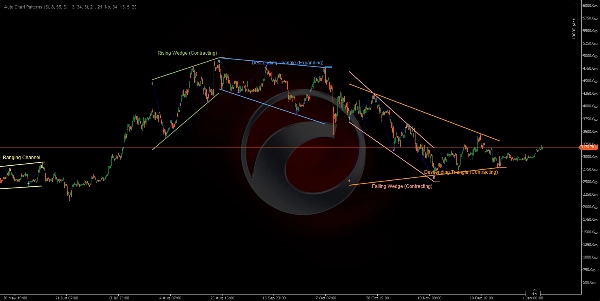
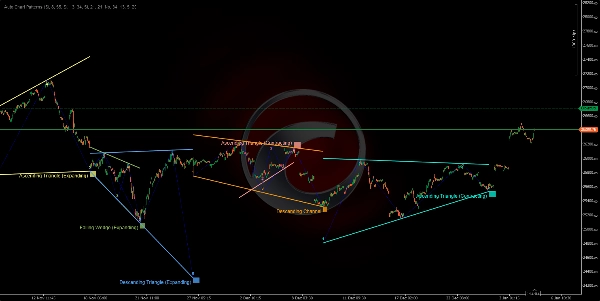
- Kênh Dao Động (Ngang/Trung Tính) ↔️
-
- Cả hai biên gần như ngang.
- Chỉ báo sự tích lũy hoặc do dự.
- Giao dịch: Chiến lược trong phạm vi, mua hỗ trợ/bán kháng cự.
NÊM MỞ RỘNG (Hình Thức Mở Rộng) 📣
4. Nêm Tăng Dần (Mở Rộng) ⚠️
* Cả hai biên đều nghiêng lên, khoảng cách ngày càng rộng.
* Mẫu đảo chiều giảm giá - giá mất đà tăng.
* Giao dịch: Chờ phá vỡ biên dưới, vào lệnh bán.
5. Nêm Giảm Dần (Mở Rộng) ⚠️
* Cả hai biên đều nghiêng xuống, khoảng cách ngày càng rộng.
* Mẫu đảo chiều tăng giá - giá mất đà giảm.
* Giao dịch: Chờ phá vỡ biên trên, vào lệnh mua.
6. Tam Giác Phân Kỳ (Tam Giác Mở Rộng) 🔺
* Biên trên nghiêng lên, biên dưới nghiêng xuống.
* Mẫu mở rộng với biến động cao.
* Giao dịch: Rất rủi ro, chờ phá vỡ rõ ràng theo hướng.
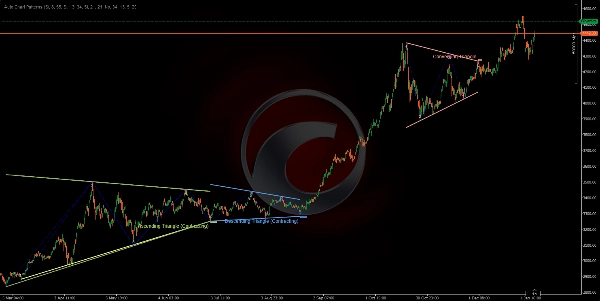
7. Tam Giác Tăng Dần (Mở Rộng) 📊
* Biên trên ngang, biên dưới nghiêng lên.
* Tiếp diễn tăng giá với phạm vi mở rộng.
* Giao dịch: Mua khi phá vỡ biên trên.
8. Tam Giác Giảm Dần (Mở Rộng) 📊
* Biên dưới ngang, biên trên nghiêng xuống.
* Tiếp diễn giảm giá với phạm vi mở rộng.
* Giao dịch: Bán khi phá vỡ biên dưới.
NÊM THU HẸP (Hình Thức Hội Tụ) 🔻
9. Nêm Tăng Dần (Thu Hẹp) 🔺
* Cả hai biên đều nghiêng lên, khoảng cách ngày càng hẹp lại.
* Mẫu đảo chiều giảm giá - sự kiệt sức của phe mua ⚠️
* Giao dịch: Bán khi phá vỡ biên dưới.
10. Nêm Giảm Dần (Thu Hẹp) 🔻
* Cả hai biên đều nghiêng xuống, khoảng cách ngày càng hẹp lại.
* Mẫu đảo chiều tăng giá - sự kiệt sức của phe bán ⚠️
* Giao dịch: Mua khi phá vỡ biên trên.
TAM GIÁC THU HẸP (Hình Thức Tích Lũy) △
11. Tam Giác Hội Tụ (Tam Giác Đối Xứng) ⚖️
* Biên trên nghiêng xuống, biên dưới nghiêng lên với tốc độ tương tự.
* Tích lũy trung tính - mẫu tiếp diễn.
* Giao dịch: Chờ hướng phá vỡ, giao dịch theo đó.
12. Tam Giác Giảm Dần (Thu Hẹp) 📐
* Biên dưới ngang (hỗ trợ), biên trên nghiêng xuống.
* Mẫu tiếp diễn giảm giá 🔴
* Giao dịch: Bán khi hỗ trợ bị phá vỡ kèm khối lượng.
13. Tam Giác Tăng Dần (Thu Hẹp) 📐
* Biên trên ngang (kháng cự), biên dưới nghiêng lên.
* Mẫu tiếp diễn tăng giá 🟢
* Giao dịch: Mua khi kháng cự bị phá vỡ kèm khối lượng.
14. Không Hợp Lệ/Không Xác Định ❌
* Các mẫu không đáp ứng tiêu chí hình học.
* Tự động bị lọc ra.
Tóm tắt
Key functionalities include identifying potential breakout zones, visualizing market structure through geometric price relationships, and supporting trading of continuation and reversal patterns with visual confirmation. Users can filter detected patterns by trend direction, pivot type, and formation category. The indicator prevents overlapping and duplicate patterns to maintain clarity.
The 14 detected formations cover a range of classical patterns such as ascending, descending, and ranging channels; expanding and contracting wedges; and various triangle types (converging, diverging, ascending, descending). Visual outputs include color-coded boundary lines, pivot numbering, zigzag swing lines, and labeled pattern names for easy interpretation. This tool supports analysis across multiple markets including Forex, stocks, commodities, indices, and cryptocurrencies.
Đánh giá của khách hàng
5 | 50 % | |
4 | 50 % | |
3 | 0 % | |
2 | 0 % | |
1 | 0 % |


