Mô tả
Chỉ báo Pinescriptlabs Store: Pinescriptlabs Store cBots : (cBot) Gold & BTC BreakoutSession Pivots(mới)
Thuật toán Thông minh Theo dõi (mới)
Hỗ trợ &
Kháng cự SmartTrend
Đường
Phân tích
Cấu trúc Thị trường
Động
của
Điểm
Quay đầu
Fibonacci
Hồi quy
Tuyến tính
Đa khung thời gian
Khe Giá Trị Công bằng Động lực
Theo dõi
Thiên hướng Nến
Đa cấp độ
Tự động
Hỗ trợ và
Kháng cự
Xu hướng
Đường
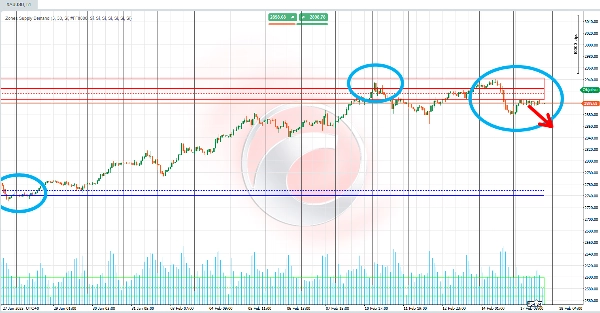
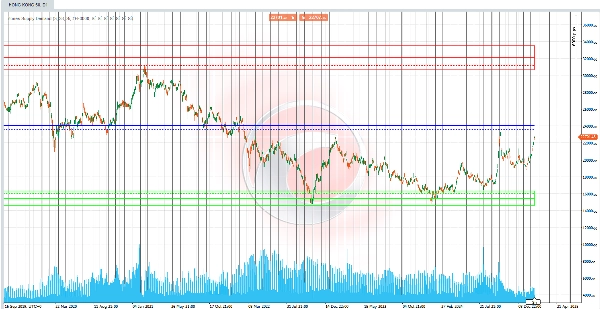
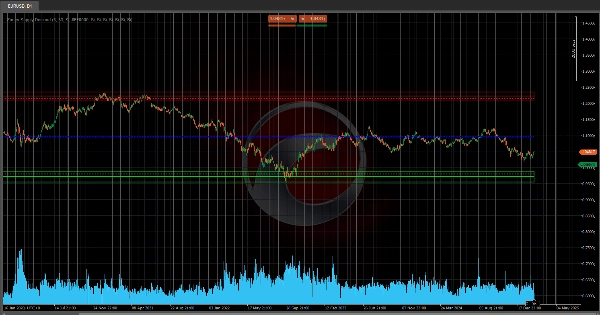
Vùng Cung & Cầu
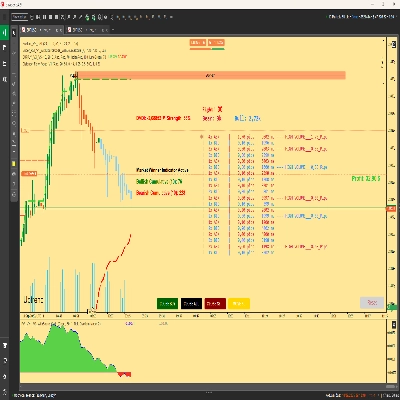
Thuật toán phân tích hành động giá thông qua tích lũy khối lượng, chia phạm vi giá hiển thị (từ cao đến thấp) thành nhiều đoạn hoặc "khoảng." 📏 Với mỗi khoảng, nó tính toán khối lượng phát sinh và so sánh với ngưỡng phần trăm đã định trước. Mục tiêu? Xác định các mức mà sự tập trung khối lượng cao đến mức báo hiệu Vùng Cung hoặc Vùng Cầu! 🎯
📉 Đối với Vùng Cung:
- Bắt đầu từ giá cao nhất và di chuyển xuống qua các khoảng.
- Tích lũy khối lượng trong mỗi đoạn.
- Khi khối lượng tích lũy vượt ngưỡng, nó đánh dấu Vùng Cung 🚨.
- Một khu vực màu (hình chữ nhật với độ mờ cụ thể) được vẽ từ mức này đến mức cao, cùng với các đường ngang hiển thị trung bình đơn giản & trọng số của giá trong vùng này. 🖍️
📈 Đối với Vùng Cầu:
- Bắt đầu từ giá thấp nhất và di chuyển lên qua các khoảng.
- Tích lũy khối lượng trong mỗi đoạn.
- Khi khối lượng tích lũy vượt ngưỡng, nó xác định Vùng Cầu 🚨.
- Một khu vực tương ứng được vẽ, cùng với các đường trung bình để làm nổi bật mức tập trung trung bình. 🖌️
⚖️ Cân bằng Thị trường:
Khi cả Vùng Cung và Vùng Cầu được xác định, thuật toán tính toán Điểm Cân bằng Thị trường! 🌟 Sự cân bằng này được lấy từ trung bình (đơn giản hoặc trọng số theo khối lượng) giữa hai vùng. Kết quả? Các đường tham chiếu rõ ràng trên biểu đồ cho thấy sự cân bằng giữa áp lực mua và bán! ⚖️✨
✅ Tóm lại:
Chỉ báo "Vùng Cung & Cầu" sử dụng phân đoạn giá dựa trên khối lượng để phát hiện các khu vực tập trung lệnh quan trọng. 🗝️ Sau đó nó tạo ra các tín hiệu trực quan (vùng màu, đường trung bình và điểm cân bằng) để làm nổi bật các mức quan trọng trên biểu đồ, giúp nhà giao dịch phát hiện mất cân bằng cung cầu và các điểm quay đầu tiềm năng! 🚀💡
Tóm tắt
Đánh giá của khách hàng
5 | 0 % | |
4 | 50 % | |
3 | 50 % | |
2 | 0 % | |
1 | 0 % |