Mô tả
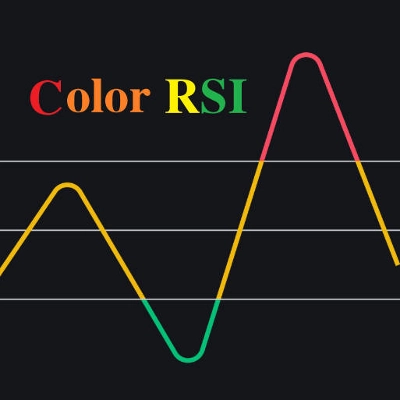
Đây là một chỉ báo siêu việt tích hợp chỉ báo RSI với hệ thống trung bình động kép. Cường độ RSI được thể hiện bằng bốn màu: đỏ (>70) > cam (>50) > vàng (>30) > xanh lá cây. Hai đường trung bình động kép sử dụng EMA với các tham số mặc định đặt ở 48/144, có thể tùy chỉnh theo nhu cầu của bạn.
Cách sử dụng:
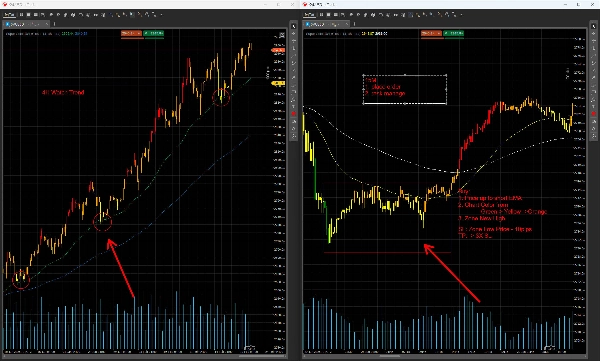
Khi sử dụng kết hợp với nhiều khung thời gian (ví dụ: 4H→15M; 1H→5M, minh họa ở đây sử dụng 4H→15M làm ví dụ):
- Xác định xu hướng qua hai EMA (khung thời gian 4H):
-
- Xu hướng tăng: 48EMA ở trên 144EMA.
- Xu hướng giảm: 48EMA ở dưới 144EMA.
- Tích lũy trong biên độ: Hai EMA bị rối vào nhau.
- Điểm vào/ra trên khung thời gian 15M:
-
- Thiết lập mua (xu hướng tăng):
-
- Giá hồi về 48EMA trên biểu đồ 4H.
- Chuyển sang 15M: Vào lệnh khi giá phá lên trên biên độ tích lũy 15M.
- Dừng lỗ: Đặt tại đỉnh swing gần nhất +10 pips .
- Thiết lập bán (xu hướng giảm):
-
- Giá hồi về 48EMA trên biểu đồ 4H.
- Chuyển sang 15M: Vào lệnh khi giá phá xuống dưới biên độ tích lũy 15M.
- Dừng lỗ: Đặt tại đáy swing gần nhất –10 pips .
- Tín hiệu phân kỳ giá:
-
- Phân kỳ giảm (đỉnh):
-
- Giá tạo đỉnh mới (khi hồi), nhưng màu RSI chuyển từ đỏ (RSI >70) sang cam (RSI >50) .
- Phân kỳ tăng (đáy):
-
- Giá tạo đáy mới (khi hồi), nhưng màu RSI chuyển từ xanh lá cây (RSI ≤30) sang vàng (RSI ≤50) .
Cảnh báo rủi ro:
Không có chỉ báo nào phù hợp với tất cả các điều kiện thị trường. Hãy thử nghiệm chiến lược này kỹ lưỡng trong môi trường demo trước khi áp dụng vào giao dịch thực. Sử dụng không đúng cách có thể dẫn đến thua lỗ đáng kể.
Tóm tắt
Hồ sơ chỉ báo
Đánh giá của khách hàng
0.0
Đánh giá: 0
Đánh giá của khách hàng
Sản phẩm này chưa có đánh giá nào. Bạn đã dùng thử chưa? Hãy là người đầu tiên chia sẻ với mọi người!
Thảo luận
Câu hỏi thường gặp
Prop
Forex
Indices
Commodities
RSI
Crypto
Stocks
Các sản phẩm có sẵn trên cTrader Store, bao gồm bot giao dịch, chỉ báo và plugin, được cung cấp bởi các nhà phát triển bên thứ ba và chỉ nhằm mục đích cung cấp thông tin và tiếp cận kỹ thuật. cTrader Store không phải là nhà môi giới và không cung cấp lời khuyên đầu tư, khuyến nghị cá nhân hay bất kỳ đảm bảo nào về hiệu suất trong tương lai.


![Logo "[Hamster-Coder] Pivot Points MTF"](https://cdn.ctrader.com/image/webp/4c143e5a-309c-40e3-a578-f04d1e133ffa_31159)


Giá
Kể từ 30/09/2024
44
Lượt bán