
Mô tả
📊 TrendHeikinMultiMA – Thuật toán xu hướng nâng cao
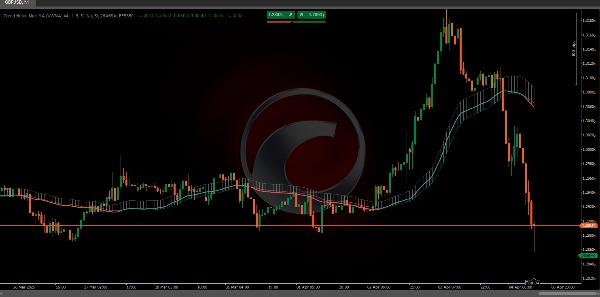
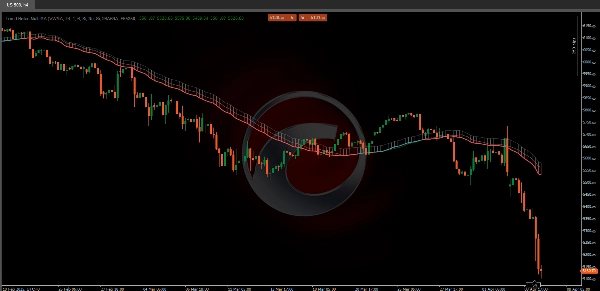
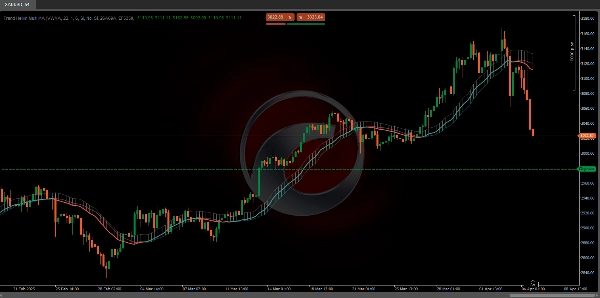
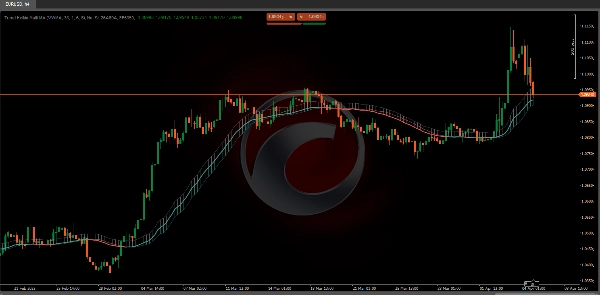
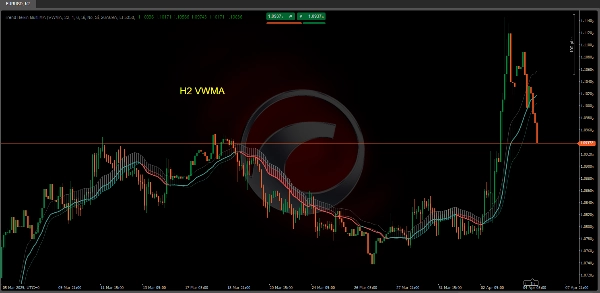
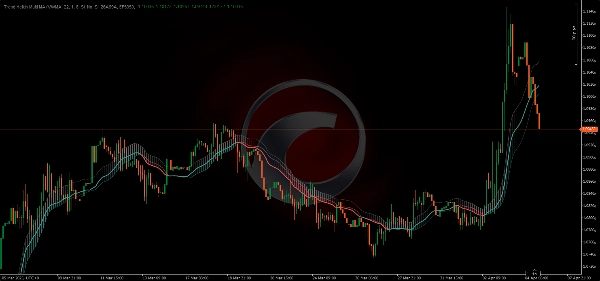
Thuật toán TrendHeikinMultiMA được thiết kế để tính toán giá trị xu hướng từ dữ liệu giá, sử dụng công thức Heikin-Ashi để làm mượt các giá trị này và áp dụng các loại trung bình động khác nhau (ALMA, HMA, SMA, SWMA, VWMA, WMA, ZLEMA, hoặc EMA).
Mặc dù giá trị Heikin-Ashi được sử dụng nội bộ, biểu đồ không hiển thị nến Heikin-Ashi truyền thống. Thay vào đó, nó vẽ đường xu hướng dựa trên các giá trị đã được làm mượt, giúp việc diễn giải hướng thị trường trở nên dễ dàng hơn mà không có sự phức tạp trực quan của biểu đồ nến.
🔄 1. Vai trò của việc làm mượt
Vì các giá trị xu hướng được lấy từ làm mượt Heikin-Ashi kết hợp với trung bình động, việc thay đổi màu sắc trong TrendHeikinMultiMA không xảy ra ngay lập tức khi giá cắt qua đường xu hướng:
- 🔹 Giá có thể tạm thời di chuyển lên trên hoặc xuống dưới đường xu hướng mà không kích hoạt thay đổi màu sắc.
- 🔹 Điều này xảy ra vì chỉ báo chờ đợi sự khác biệt đáng kể và bền vững giữa giá mở và đóng đã được làm mượt để xác nhận sự đảo chiều xu hướng thực sự.
✅ Ưu điểm trong việc diễn giải
Việc trì hoãn có chủ ý trong thay đổi màu sắc giúp tránh các tín hiệu sai. Trong biểu đồ nến truyền thống, giá có thể tạm thời cắt qua đường xu hướng và kích hoạt các tín hiệu sớm.
- 🟥 Ví dụ, ngay cả khi giá hiện tại nằm trên đường xu hướng giảm, chỉ báo sẽ vẫn màu đỏ (giảm giá) cho đến khi các giá trị đã làm mượt xác nhận rằng giá đóng cửa liên tục cao hơn giá mở cửa.
- 🟩 Tương tự, để chuyển sang màu xanh (tăng giá), trung bình động dựa trên Heikin-Ashi phải xác nhận rằng giá đóng cửa liên tục vượt quá giá mở cửa.
📈 2. Áp dụng trung bình động cho các giá trị Heikin-Ashi
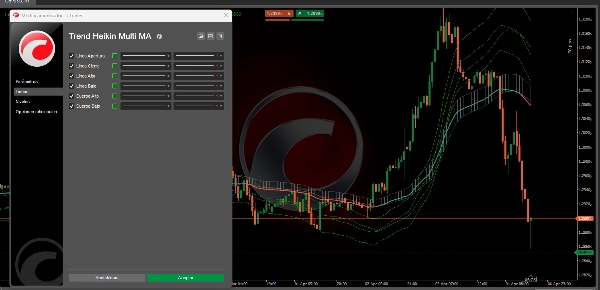
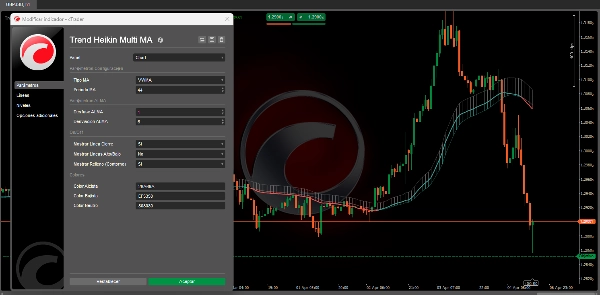
- 🔄 Lựa chọn trung bình động:
-
- Người dùng có thể chọn giữa các loại trung bình động khác nhau (ALMA, HMA, SMA, SWMA, VWMA, WMA, ZLEMA và EMA).
- Mỗi loại trung bình động áp dụng một phương pháp toán học cụ thể để trọng số và làm mượt các giá trị lịch sử của giá mở, đóng, cao và thấp được lấy từ Heikin-Ashi.
🏆 3. Ưu điểm khi sử dụng TrendHeikinMultiMA so với nến truyền thống
- 📉 Giảm nhiễu:
-
- Nến truyền thống thường hiển thị biến động cao và dữ liệu phân tán, khiến việc xác định xu hướng tổng thể trở nên khó khăn hơn.
- TrendHeikinMultiMA làm mượt dữ liệu này, lọc bỏ các biến động nhỏ và loại bỏ các dao động đột ngột, giúp nhà giao dịch tập trung vào hướng thị trường chính.
✅ Kết luận
Tóm lại, TrendHeikinMultiMA chỉ xác nhận sự thay đổi xu hướng (tăng hoặc giảm) khi giá mở và đóng đã được làm mượt — được tính từ Heikin-Ashi và xử lý qua trung bình động đã chọn — liên tục cho thấy hành vi thị trường đã đảo chiều.
Điều này đảm bảo rằng các tín hiệu đáng tin cậy hơn và ít bị ảnh hưởng bởi nhiễu như trong các biểu đồ nến truyền thống. 🚀📊
🔥 Các chỉ báo Pinescritlabs Ctrader Store 🔥
Cấu trúc thị trường động
Phân tích các điểm quay đầu
Hồi quy Fibonacci tuyến tính
đa khung thời gian
Đường hỗ trợ và
kháng cự tự động
Tất cả các mức hỗ trợ và
kháng cự
Tóm tắt
The indicator incorporates a smoothing mechanism that delays color changes to confirm trend reversals only after a significant and sustained difference between smoothed open and close values is detected. This approach reduces false signals caused by brief price fluctuations crossing trend lines.
Users can select from multiple moving average types, each applying distinct mathematical weighting methods to the Heikin-Ashi-derived open, close, high, and low values, enhancing customization and adaptability to different trading styles.
Compared to traditional candlestick charts, Trend Heikin Multi MA filters out minor price fluctuations and abrupt swings, allowing traders to focus on primary market trends with more reliable signals. It confirms bullish or bearish trend changes only when smoothed values consistently indicate a market direction reversal, improving signal accuracy and reducing noise.
Đánh giá của khách hàng
5 | 33 % | |
4 | 67 % | |
3 | 0 % | |
2 | 0 % | |
1 | 0 % |


