
Description
Indicateurs du magasin Pinescriptlabs : cBots du magasin Pinescriptlabs : (cBot) Gold & BTC BreakoutSession Pivots(nouveau)
Projection de liquidité du prix ZigZag
Algorithme intelligent de suivi (nouveau)
Carte de liquidation de levier
Prédiction basée sur Linreg & ATR
Support SmartTrend &
Résistance
Lignes
Analyse
dynamique
de la structure
du marché
des
points de retournement
Régression
linéaire
Fibonacci
multi-échelle
Gradient de tendance dynamique
Suivi
du biais
multi-niveaux de chandeliers
Support et
résistance
automatiques
de tendance
lignes
Tous
les supports et
résistances
niveaux
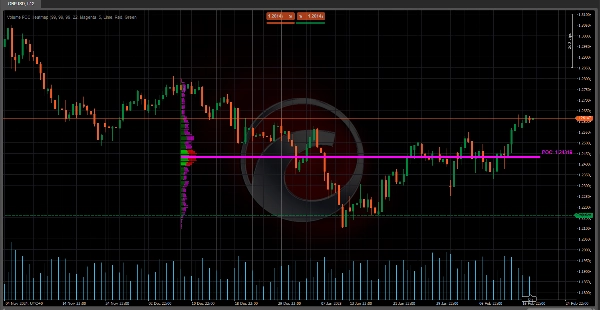
🔥 Carte thermique Volume POC 🔥
Cet indicateur est un profil de volume qui affiche la répartition du volume échangé à différents niveaux de prix pendant une période spécifique. Son objectif principal est d'identifier les zones clés de support/résistance et les zones où le marché a montré le plus d'intérêt (activité d'achat/vente élevée). Il est très utile pour :
- Détecter le Point de Contrôle (POC) 🎯
Le niveau de prix avec le volume le plus élevé, agissant comme un aimant pour l'action des prix. - Visualiser la Zone de Valeur (VA)
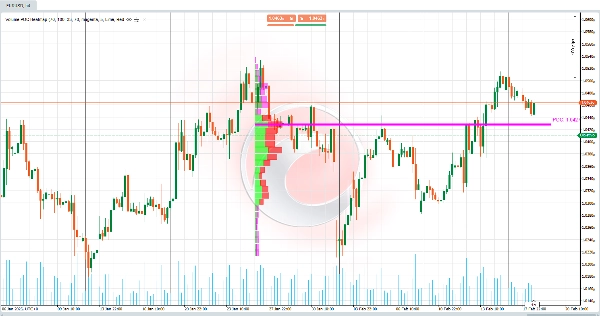
La zone où un pourcentage spécifique du volume total est concentré (par exemple, 70 %), indiquant un équilibre entre acheteurs et vendeurs. - Différencier le volume haussier et baissier 📈📉
Montre où s'accumulent la puissance d'achat et la pression de vente.
🧠 Logique clé et calculs 🔢
- Division de la plage de prix 📏
-
- La plage de prix (du plus bas au plus haut des B Barres dernières) est divisée en Cellules de volume (CNum) .
Exemple : si CNum = 33 , la plage est divisée en 33 niveaux équidistants.
- La plage de prix (du plus bas au plus haut des B Barres dernières) est divisée en Cellules de volume (CNum) .
- Distribution du volume par niveau 📊
-
- Pour chaque barre dans les données historiques :
-
- Le volume associé au corps (différence entre l'ouverture et la fermeture) et aux mèches (hauts et bas) est calculé.
- Le volume est réparti proportionnellement sur les cellules de prix traversées par la barre.
Exemple : si une barre verte (haussière) couvre 3 cellules, le volume est principalement attribué à ces cellules comme "volume haussier".
- Calcul du Point de Contrôle (POC) 🎯
-
- Le POC est la cellule avec le volume accumulé le plus élevé, représentant le prix où il y avait le plus de consensus entre acheteurs et vendeurs.
- Calcul de la Zone de Valeur (VA) 🔄
-
- S'étend du POC vers le haut/bas jusqu'à englober le % spécifié du volume total (par exemple, 70 %).
Exemple : si la VA s'étend de 100 à 105 , cela signifie que 70 % du volume a été échangé dans cette plage.
- S'étend du POC vers le haut/bas jusqu'à englober le % spécifié du volume total (par exemple, 70 %).
- Normalisation visuelle 🖼️
-
- Les volumes sont mis à l'échelle à l'aide d'un facteur d'échelle pour ajuster la largeur des barres sur le graphique, facilitant la visualisation.
🛠️ Clé de la carte thermique Volume POC 💡
- Manque de contexte dans les indicateurs de volume traditionnels 🤔
Les indicateurs de volume classiques (comme le volume barre par barre) ne montrent pas où le volume a été échangé. Cet indicateur cartographie le volume par niveau de prix, résolvant ce problème. - Identification organique du support/résistance 🚀
Les zones à fort volume agissent comme un support/résistance dynamique, plus fiable que les lignes statiques. - Détection des déséquilibres ⚖️
Les zones avec un volume principalement haussier ou baissier signalent des cassures ou retournements potentiels.
💡 Utilisation pratique en trading 📈
- POC comme zone d'intérêt 🎯
-
- Si le prix approche le POC, attendez-vous à des réactions comme des rebonds ou des consolidations.
- Zone de valeur (VA) comme zone d'équilibre 🔄
-
- Si le prix est en dehors de la VA, il a tendance à y revenir (effet magnétique).
- Si le prix est à l'intérieur de la VA, cela peut indiquer une consolidation.
- Volume haussier/baissier comme confirmation 🔍
-
- Un pic de volume haussier à la résistance suggère une cassure potentielle.
- Un volume baissier élevé au support indique une possible rupture.
🌟 Exemple 📊
Paramètres utilisés (visibles et configurables par l'utilisateur) :
- Barres en arrière = 55 → Nombre de barres historiques analysées.
- Cellules de volume = 33 → Nombre de divisions/cellules dans la plage de prix.
- Pourcentage de volume de la zone de valeur = 70 → Pourcentage du volume définissant la zone de valeur.
Situation :
- Le prix franchit un niveau de support technique, mais le volume dans cette zone est faible (selon le profil).
- Plus tard, le prix revient à la zone de valeur (VA) définie par 70 % du volume total.
Interprétation :
- La cassure était fausse (en raison du faible volume dans la zone de cassure).
- Le marché cherche à se rééquilibrer dans la zone de valeur , où l'activité est plus élevée (densité de volume élevée).
Action :
- Cherchez des opportunités d'achat près de la limite inférieure de la VA ou du POC, car ce sont des zones d'intérêt élevé pour les participants au marché.
Résumé
Key functionalities include:
- Division of the price range into multiple volume cells for detailed volume mapping.
- Calculation of POC as the volume consensus price.
- Determination of the Value Area around the POC.
- Visual normalization of volume bars for clearer chart representation.
This tool addresses the limitation of traditional volume indicators by showing where volume was traded rather than just total volume per bar. It helps identify dynamic support and resistance zones based on volume concentration and detects volume imbalances that may signal potential breakouts or reversals. Traders can use it to anticipate price reactions near the POC and VA, aiding in decision-making for entries and exits. Configurable parameters include the number of historical bars analyzed, volume cells, and the percentage defining the Value Area.
Avis clients
5 | 100 % | |
4 | 0 % | |
3 | 0 % | |
2 | 0 % | |
1 | 0 % |