
说明
🚀 超过10,000名交易者已经使用我们的顶级 指标🏆
👉 在这里获取我们所有的顶级系统:
_______________________________________________
📌 市场结构指标
· ✅ 高级市场结构:Bos,Choch,SwinLevels,订单区块, 市场结构& 流动性发现器
· 🔄动态市场结构转折点分析
· 🧱 订单区块
· ⚖️ 市场失衡
· ⛓️ BOS & CHOCH
· 🧠 ICT 三力
· 🌀 市场极性区域
_______________________________________________
🔚 智能退出系统
· 📍 追踪智能算法
_______________________________________________
📐 之字形指标
· 🔍 之字形价格流动性投影
· 🧭 支撑阻力结构之字形
· ➖ 之字形
· 🎯 之字形极端追踪器
_______________________________________________
🧱 支撑与阻力指标
· 🟩 智能趋势支撑与阻力线
· 🧱 所有支撑和阻力水平
_______________________________________________
📊 趋势与通道指标
· 🔄 自动趋势通道
· 📊 超级趋势
· ⚡动量趋势分析器
· 🧠 自适应趋势通道
· 💥 通道突破系统
· 🌈 动态趋势梯度
· ⭐ 高级SSL通道
· 🔁 反应性移动平均线
_______________________________________________
💧 成交量与流动性工具
· 🔥 成交量POC热力图
· 📉 杠杆清算图
· 🔍 动量公平价值缺口
· 🕒 公平价值缺口时段
_______________________________________________
⚡ 动量与RSI指标
· 📈 RSI趋势触发器
· 🚀 动态范围动量
· 🔎 多级蜡烛偏向
追踪器
_______________________________________________
🔮 预测与投影工具
· 📐 基于线性回归和ATR的预测
· 📏 斐波那契线性回归多时间框架
· 📈 成交量驱动的市场流动投影器
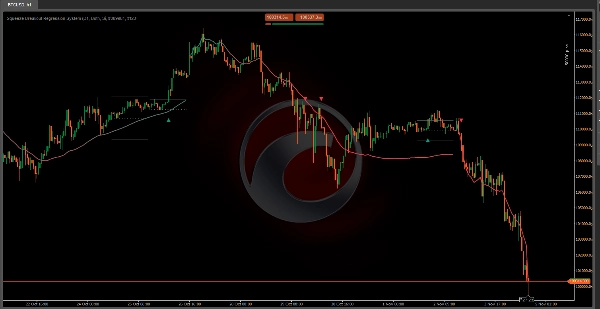
📊 挤压突破回归系统 -🚀
🎯 它是什么,有何用途? ❓
该指标结合了两个互补系统,以识别高概率交易机会:
- 挤压系统(波动率压缩):🔍 侦测市场“压缩”且即将向任一方向爆发的时刻 💥
- 趋势通道系统(线性回归):📈 显示主导趋势及其动态支撑/阻力界限
🔍 它如何工作? ⚙️
第一部分:挤压检测
指标分析较高时间框架(默认:日线),寻找蜡烛的区间(高低差)为以下范围内最小:
• 7周期 = “短期挤压”(短期压缩)
• 10周期 = “扩展挤压”(扩展压缩 - 更强)💪
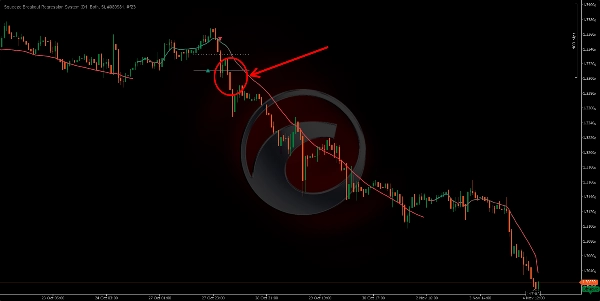
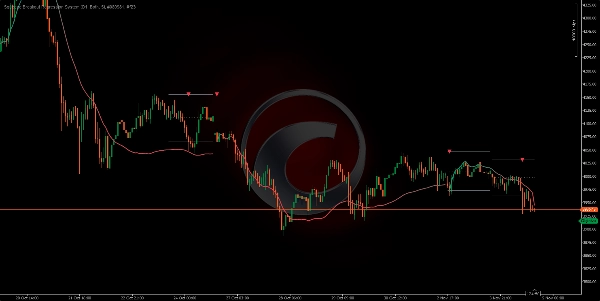
检测到挤压时会发生什么?
- 绘制三条水平线:
o 上线 = 阻力(向上突破的水平)↗️
o 下线 = 支撑(向下突破的水平)↘️
o 中心虚线 = 枢轴点(中点)⚖️ - 等待突破:
o 如果价格向上突破阻力 → 多头信号(绿色三角形)🟢
o 如果价格向下突破支撑 → 空头信号(红色三角形)🔴
智能过滤器:🧠
• 对于多头信号:价格必须先在枢轴点下方,然后上升
• 对于空头信号:价格必须先在枢轴点上方,然后下降
• 这样可以消除价格已远离区间时的假信号 ❌
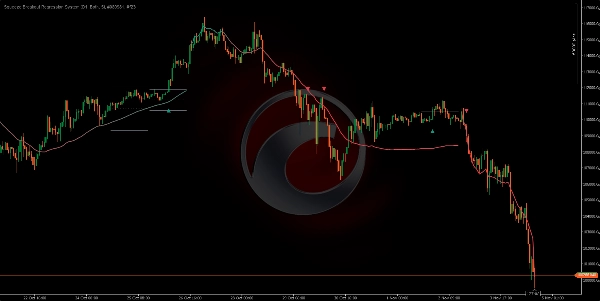
第二部分:回归趋势通道
通过线性回归数学计算最佳趋势线,并绘制带有以下内容的动态通道:
• 粗实中心线(上涨为绿色,下跌为红色)🎨
- 突破警报 🚨
显示突破信号
• 功能:显示/隐藏信号三角形
• 影响:关闭后看不到箭头,但框和线仍可见
• 建议:始终开启 ✅
多头/空头突破颜色
• 功能:更改多头/空头信号颜色
• 影响:仅视觉效果,不影响检测
• 建议:多头绿色,空头红色(默认)🟢🔴 - 趋势通道(Trend Channel)📊
通道方法
• 选项:滚动 / 静态
• 功能:
o 滚动:通道逐条柱子适应(流动)🔄
o 静态:通道在周期开始时绘制一次并延伸(直线)➖
• 影响:滚动更动态,静态更清晰显示初始趋势
• 建议:实时跟踪用滚动 ⌚
锚点类型
• 选项:周期性 / 第一根柱子
• 功能:
o 周期性:每个新周期重置计算(周,月等)📅
o 第一根柱子:从图表第一根柱子计算(永不重置)🏁
• 影响:周期性每周期给出干净通道,第一根柱子显示全局趋势
• 建议:结构化分析用周期性 🧱
通道周期
• 功能:通道计算重置频率
• 默认:每周(Weekly)🗓️
• 影响:
o 短周期(日线)→ 通道频繁变化,跟随快速变化
o 长周期(月线)→ 通道更稳定,显示潜在趋势
• 建议:每周是完美平衡 ⚖️
价格来源
• 选项:收盘 / 开盘 / 最高 / 最低 / 典型 / 加权
• 功能:用于计算通道的价格
• 影响:收盘价最常用,典型价平滑计算
• 建议:精确用收盘,平滑用典型 🎯
偏差乘数
• 功能:乘以标准差以调整通道宽度
• 默认:1.0
• 影响:
o 低值(0.5-0.8)→ 通道窄,触及信号多但假信号也多
o 高值(1.5-2.0)→ 通道宽,触及少但更可靠
• 建议:1.0为最佳平衡 ⚖️ - 通道颜色 🎨
动态颜色
• 功能:根据趋势改变通道颜色(上涨为绿色,下跌为红色)
• 影响:关闭后仅使用单一颜色(上升趋势色)
• 建议:开启以快速识别趋势 🚦
上升/下降趋势颜色
• 功能:定义上升/下降趋势颜色
• 影响:仅视觉效果
• 建议:绿色/红色(经典)🟢🔴
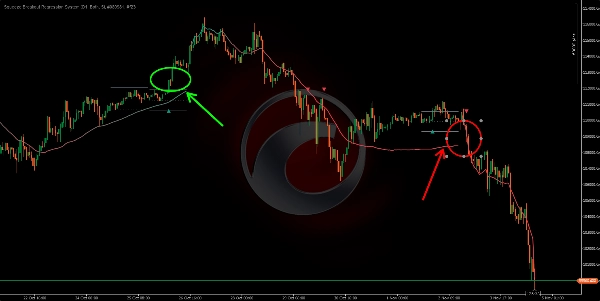
🟢 多头操作 📈
- 挤压检测:
• 出现3条水平线(支撑,枢轴,阻力)
• 价格在这些水平间被压缩 - 突破准备:
• 价格位于枢轴点(中心虚线)下方
• 激活寻找多头突破的条件 - 关键汇聚 - 进场时机:🎯
• ✅ 出现绿色三角形(多头突破确认)🟢
• ✅ 回归通道为绿色(上升趋势确认)📗
• ✅ 价格突破上方挤压线 ↗️
🔴 空头操作 📉
- 挤压检测:
• 再次出现3条水平线
• 识别新的压缩区 - 空头突破准备:
• 价格位于枢轴点(虚线)上方
• 激活寻找空头突破的条件 - 关键汇聚 - 进场时机:🎯
• ✅ 出现红色三角形(空头突破确认)🔴
• ✅ 回归通道为红色(下降趋势确认)📕
• ✅ 价格突破下方挤压线 ↘️
摘要
The Trend Channel System uses linear regression to calculate the dominant trend and dynamically draws a channel with color-coded trend direction (green for uptrend, red for downtrend). It offers configurable options such as rolling or static channels, periodic or continuous anchoring, channel period, price source, and deviation multiplier to adjust channel width and responsiveness.
The indicator supports breakout alerts with visual signals for bullish and bearish breakouts, aiding traders in timing entries. It is applicable across various markets including Forex, cryptocurrencies, stocks, and indices, with symbols like BTCUSD, EURUSD, GBPUSD, XAUUSD, NAS100, and USDJPY. The system integrates volatility compression detection with trend analysis to assist in identifying breakout trading opportunities.


