
Mô tả
Tổng quan
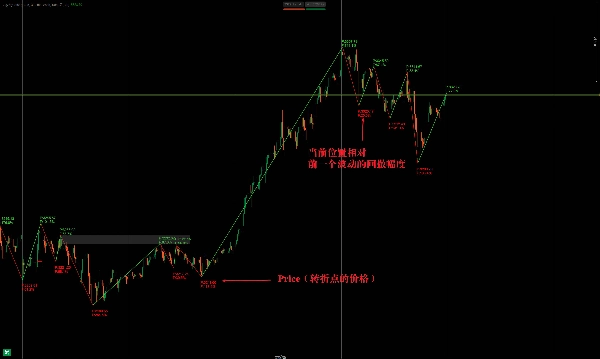
Chỉ báo ZigZag là một công cụ phân tích kỹ thuật chủ yếu được sử dụng để xác định các điểm đảo chiều giá quan trọng bằng cách lọc bỏ nhiễu thị trường. Nó kết nối các đỉnh và đáy quan trọng bằng các đường ZigZag, giúp nhà giao dịch hình dung xu hướng và các khả năng bứt phá tiềm năng.
Cách ZigZag Hoạt động
- Chức năng chính
-
- Nó loại bỏ các biến động giá nhỏ bằng cách đặt ngưỡng thay đổi giá tối thiểu (theo phần trăm hoặc giá trị cố định).
- Chỉ kết nối các đỉnh/đáy dao động có ý nghĩa, đơn giản hóa phân tích xu hướng.
- Thường được sử dụng để phát hiện các mức hỗ trợ/kháng cự, các điểm đảo chiều (ví dụ: đầu & vai, đỉnh/đáy đôi).
- Các tham số chính
-
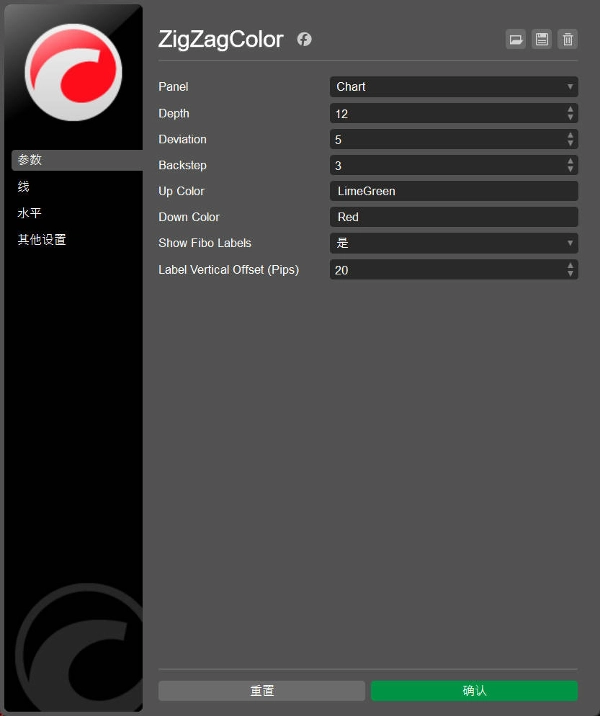
- Biến động giá tối thiểu (%): Xác định độ nhạy (ví dụ: 5% bỏ qua các biến động nhỏ hơn mức này).
- Độ sâu nhìn lại: Kiểm soát số lượng nến quá khứ được phân tích, ảnh hưởng đến độ trễ.
Ứng dụng chính
1. Nhận diện xu hướng
- Xu hướng tăng: Đỉnh cao hơn (HH) + đáy cao hơn (HL).
- Xu hướng giảm: Đỉnh thấp hơn (LH) + đáy thấp hơn (LL).
- Giúp vẽ đường xu hướng cho các giao dịch bứt phá tiềm năng.
2. Nhận dạng mẫu hình
- Hiển thị các mẫu biểu đồ cổ điển (tam giác, cờ, nêm) bằng cách xác định các điểm dao động.
3. Mức thoái lui Fibonacci
- Đánh dấu các đỉnh/đáy dao động rõ ràng cho mở rộng Fibonacci hoặc thoái lui.
4. Phát hiện phân kỳ
- Làm nổi bật sự phân kỳ giữa giá và các chỉ báo dao động (RSI, MACD).
ZigZag 指标是一种用于技术分析的工具,主要用于识别价格趋势中的关键转折点,帮助交易者过滤市场噪音,突出重要的高点和低点。以下是其核心要点及用法:
ZigZag 指标的原理
- 基本功能:
-
- 通过设定价格波动的阈值(百分比或固定值),自动忽略小幅波动,仅连接显著的高点和低点,形成折线(ZigZag 形态)。
- 常用于辅助识别支撑/阻力位、趋势反转(如头肩顶、双底等形态)。
- 核心参数:
-
- 最小波动幅度(如5%或点数):决定过滤小波动的灵敏度。值越大,信号越少但更可靠。
- 回溯深度:控制计算时参考的K线数量,影响转折点的延迟性。
主要用途
- 趋势识别:
-
- 通过连续的高点抬高(上升趋势)或低点降低(下降趋势)判断趋势方向。
- 结合趋势线,可提前预判突破或回调。
- 形态分析:
-
- 识别经典价格形态(如三角形、旗形),ZigZag 线条能清晰显示形态边界。
- 斐波那契工具配合:
-
- 用ZipZag标记的波段高/低点,作为斐波那契回撤或扩展的起点/终点。
- 背离检测:
-
- 价格与指标(如RSI、MACD)出现背离时,ZipZag帮助确认背离段的起点和终点。
Tóm tắt
Hồ sơ chỉ báo
Đánh giá của khách hàng
0.0
Đánh giá: 0
Đánh giá của khách hàng
Sản phẩm này chưa có đánh giá nào. Bạn đã dùng thử chưa? Hãy là người đầu tiên chia sẻ với mọi người!
Thảo luận
Câu hỏi thường gặp
Prop
Forex
Breakout
Indices
Commodities
RSI
Crypto
Stocks
MACD
Các sản phẩm có sẵn trên cTrader Store, bao gồm bot giao dịch, chỉ báo và plugin, được cung cấp bởi các nhà phát triển bên thứ ba và chỉ nhằm mục đích cung cấp thông tin và tiếp cận kỹ thuật. cTrader Store không phải là nhà môi giới và không cung cấp lời khuyên đầu tư, khuyến nghị cá nhân hay bất kỳ đảm bảo nào về hiệu suất trong tương lai.


![Logo "[Hamster-Coder] Pivot Points MTF"](https://cdn.ctrader.com/image/webp/4c143e5a-309c-40e3-a578-f04d1e133ffa_31159)


Giá
Kể từ 30/09/2024
44
Lượt bán