
Liquidity Cluster Order
指标
2 购买
版本 1.0, Nov 2025
Windows 版、Mac 版
5.0
评价:1
说明
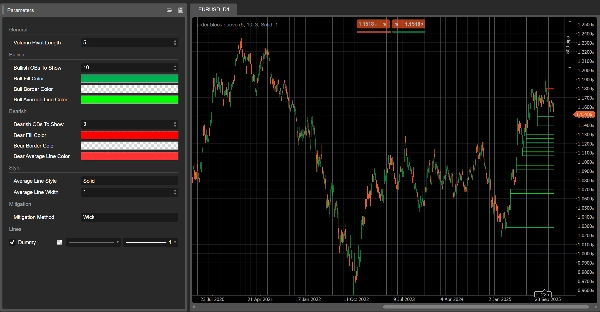
流动性簇订单 (LCO) 🔍💧
1. LCO 显示的内容
流动性簇订单 自动检测并绘制:
- 看涨流动性簇(潜在需求/积累区)✅
- 看跌流动性簇(潜在供应/分配区)🔻
每个簇:
- 锚定在 成交量枢轴柱(成交量的局部最大值),
- 根据最近的价格延伸被分类为 看涨 或 看跌,
- 向前时间 延伸,直到价格 缓解(消耗)该簇。
图表上你会看到:
- 绿色矩形 → 看涨流动性簇
- 红色矩形 → 看跌流动性簇
- 每个矩形内的 灰色线 → 该簇的 平均价格水平
一旦簇被认为是 缓解,它将从图表中消失,只剩下活跃的簇。
2. 检测逻辑(简单说明)
- 成交量枢轴
-
- LCO 扫描成交量高于前后
Volume Pivot Length根柱的柱子。 - 这些柱子是 成交量枢轴 – 流动性簇的潜在锚点。
- LCO 扫描成交量高于前后
- 背景:看涨与看跌
-
- 最近的价格行为定义了一个 背景:
-
- 看涨背景 → 下行延伸占主导。
- 看跌背景 → 上行延伸占主导。
- 该背景决定下一个成交量枢轴将创建 看涨 或 看跌 流动性簇。
- 看涨流动性簇
在 看涨背景 中: -
- 簇底 = 枢轴柱的最低价
- 簇顶 = 柱子的中点(
(高 + 低) / 2) - 解释:该区域是 下行压力被吸收,买方积极介入的区域。
- 看跌流动性簇
在 看跌背景 中: -
- 簇底 = 枢轴柱的中点
- 簇顶 = 枢轴柱的最高价
- 解释:该区域是 上行压力被吸收,卖方掌控的区域。
- 平均线
-
- 对于每个簇,LCO 计算顶部和底部的平均值并绘制 灰色中线。
- 这作为簇的内部 平衡水平。
- 缓解(簇消耗)
每根新柱,LCO 检查簇是否被 缓解: -
- 对于 看涨簇:
-
- 它跟踪过去
Volume Pivot Length根柱的下行 目标价: -
Mitigation Method = Wick→ 最低 低点。Mitigation Method = Close→ 最低 收盘价。
- 如果该目标价 低于簇底,则看涨簇被视为 缓解 并被移除。
- 它跟踪过去
- 对于 看跌簇:
-
- 它跟踪上行 目标价:
-
Wick→ 最高 高点。Close→ 最高 收盘价。
- 如果该目标价 高于簇顶,则看跌簇被 缓解 并被移除。
缓解 = 该簇中的流动性被假定为 消耗/失效。
3. 如何在图表上读取 LCO
你主要会看到:
- 价格下方的绿色簇 → 潜在的 需求流动性 区域
- 价格上方的红色簇 → 潜在的 供应流动性 区域
典型解读(非交易建议):
- 新鲜簇
-
- 最近创建的簇通常更相关:
-
- 价格下方的看涨簇 → 买方最后吸收卖压的区域。
- 价格上方的看跌簇 → 卖方最后吸收买压的区域。
- 簇的回测
-
- 价格从上方回到 看涨簇:
-
- 如果价格反应并守住底部 → 可能的 反弹/多头反应区。
- 价格从下方回到 看跌簇:
-
- 如果价格未能突破顶部 → 可能的 拒绝/空头反应区。
- 缓解簇与活跃簇
-
- 当价格根据所选缓解方法 突破 簇的边界,
→ 该流动性簇将在后续柱中被 移除。 - 仍然可见的簇是 活跃流动性区域,尚未完全被交易穿透。
- 当价格根据所选缓解方法 突破 簇的边界,
- 使用中线
-
- 该灰色中线可用作:
-
- 簇内的获利了结或部分退出水平,
- 流动性区域内的“公平价格”参考,
- 快速判断价格是否在簇的 上半部或下半部。
4. 参数(英文)
Volume Pivot Length
- 用于:
-
- 检测成交量枢轴,
- 计算极值和缓解目标。
- 较低值 → 更多簇,更多噪音;
- 较高值 → 更少但更重要的簇。
显示的看涨流动性簇
(前称 显示的看涨OB)
- 图表上显示的最大 看涨簇 数量。
显示的看跌流动性簇
(前称 显示的看跌OB)
- 显示的最大 看跌簇 数量。
看涨填充色 / 看跌填充色
- 看涨/看跌簇的填充颜色。
- 你可以包含透明度(alpha)值。
看涨/看跌平均线颜色
- 每个簇内部中线的颜色。
平均线样式
- 中线的视觉样式:
"Solid","Dashed","Dotted"。
平均线宽度
- 中线的粗细。
缓解方法
"Wick"→ 基于 高/低影线 的缓解(更敏感)。"Close"→ 基于 收盘价 的缓解(更保守)。
摘要
AI 摘要
Liquidity Cluster Order (LCO) is a trading indicator that automatically identifies and visualizes key liquidity zones on price charts. It detects bullish liquidity clusters (potential demand or accumulation zones) and bearish liquidity clusters (potential supply or distribution zones) by anchoring each cluster on volume pivot bars—local volume maxima—and classifies them based on recent price extensions.
On the chart, bullish clusters appear as green rectangles below the price, indicating areas where buyers absorbed selling pressure. Bearish clusters are shown as red rectangles above the price, marking zones where sellers absorbed buying pressure. Each cluster includes a grey mid-line representing the average price level, serving as an internal equilibrium reference.
Clusters extend forward in time until price "mitigates" or consumes them, at which point they disappear, leaving only active liquidity zones visible. Mitigation is determined by tracking price extremes (high/low wicks or closing prices) over a configurable number of bars.
Key parameters include the volume pivot length (defining sensitivity and cluster significance), maximum clusters displayed, cluster colors, mid-line style, and mitigation method. LCO supports various markets including forex, indices, commodities, stocks, and cryptocurrencies, and integrates with multiple trading strategies and indicators such as RSI, MACD, Bollinger Bands, and Fibonacci levels.
指标配置
客户评价
5.0
评价:1
5 | 100 % | |
4 | 0 % | |
3 | 0 % | |
2 | 0 % | |
1 | 0 % |
客户评价
November 18, 2025
Two timeframes give more context. The first signal should not decide the only input.
讨论
常见问答
Signal
Indices
Commodities
GBPUSD
RSI
Bollinger
Fibonacci
Scalping
AI
XAUUSD
NAS100
MACD
BTCUSD
Forex
Breakout
EURUSD
NZDUSD
Martingale
Prop
Supertrend
Fair Value Gap
SMC
Crypto
Grid
Stocks
ATR
USDJPY
VWAP
cTrader Store 提供的所有产品,包括交易机器人、指标和插件,均由第三方开发者提供,仅供信息参考和技术访问之用。cTrader Store 并非经纪商,不提供投资建议、个人推荐或任何未来业绩保证。


价格
42.11M
交易量
6.13M
盈利点数
225
销售
8.44K
免费安装