
说明
突破通道
它的功能
突破通道 自动检测盘整区间(价格“箱体”)并标记突破点,当价格突破这些区间时。
它绘制:
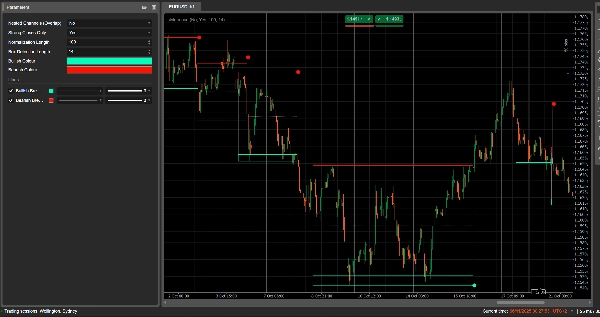
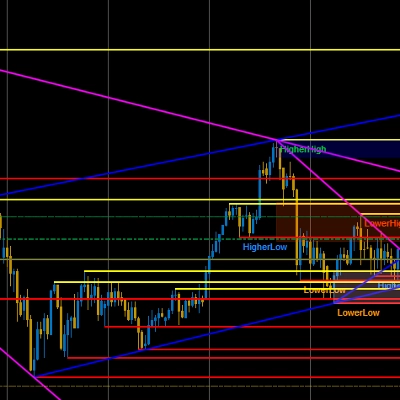
- 一个灰色通道框围绕盘整区
- 一个红色上轨(潜在阻力)
- 一个绿色下轨(潜在支撑)
- 一个白色虚线中线(通道中点)
- 彩色点当发生突破时:
-
- 箱体下方的绿色/青色点 → 看涨突破
- 箱体上方的红点 → 看跌突破
其目的是直观突出价格盘旋的区域,以及当区间突破时可能开始强劲走势的区域。
计算方法
- 价格归一化
-
- 在过去归一化长度根K线中找到最高价和最低价。
- 将收盘价归一化到0到1的范围:
normalizedPrice=Close−LowestLowHighestHigh−LowestLow\text{normalizedPrice} = \frac{\text{Close} - \text{LowestLow}}{\text{HighestHigh} - \text{LowestLow}}normalizedPrice=HighestHigh−LowestLowClose−LowestLow
- 波动率测量
-
- 计算归一化价格在14根K线上的标准差。
- 这产生了一个波动率序列,用于检测市场结构中的转折点。
- 上下“波动率线”
-
- 在过去(箱体检测长度 + 1)根K线中,找到:
-
- 波动率最高的K线
- 波动率最低的K线
- 根据这些极值发生的K线数,构建两条合成线:上轨和下轨。
- 这两条线的交叉信号表示通道阶段的潜在开始/结束。
- 通道开始及持续时间
-
- 当下轨上穿上轨时,指标标记一个潜在通道开始。
- 从该K线开始跟踪持续时间以及该期间的最高价/最低价。
- 通道创建
-
- 当随后上轨下穿下轨且持续时间大于10根K线时:
-
- 定义通道顶部为该期间的最高价。
- 定义通道底部为最低价。
- 测量当前ATR/2以区分顶部和底部的薄区域:
-
- 红色带位于顶部(看跌带)
- 绿色带位于底部(看涨带)
- 绘制:
-
- 灰色轮廓矩形(完整通道)
- 红色顶部轮廓
- 绿色底部轮廓
- 一条白色虚线中线贯穿中心
- 通道作为历史结构保留在图表上(突破后不删除)。
- 突破检测
-
- 对于每个活动通道,每根新K线计算一个参考价格:
-
- 如果仅强收盘 = true→ 使用蜡烛实体中点:
refPrice=(Open+Close)/2\text{refPrice} = (\text{Open} + \text{Close})/2refPrice=(Open+Close)/2
这要求实体超过一半在箱体外。 - 如果仅强收盘 = false→ 使用简单的收盘价。
- 如果仅强收盘 = true→ 使用蜡烛实体中点:
- 突破规则:
-
- 如果
refPrice > Top→看涨突破 -
- 在通道底部绘制一个绿色点。
- 停用该通道(停止延伸),但箱体保持可见。
- 如果
refPrice < Bottom→看跌突破 -
- 在通道顶部绘制一个红色点。
- 停用该通道。
- 否则,通道仍然活跃,其右边缘延伸到当前K线。
- 如果
- 嵌套通道选项
-
- 如果嵌套通道 = true,多个通道可以在时间和价格上重叠。
- 如果false,指标阻止创建与现有通道重叠的新通道。
如何阅读和使用它
- 灰色箱体(通道)
-
- 表示一个盘整/平衡区,价格在此交易了一段时间。
- 箱体越长越高,区间越重要。
- 红色上轨(阻力区)
-
- 通道的顶部部分,视觉上强调为潜在阻力区。
- 该带附近的多次拒绝表明区间内的卖压。
- 绿色下轨(支撑区)
-
- 通道的底部部分,突出显示为潜在支撑。
- 多次反弹表明买家在防守区间的下边缘。
- 白色虚线中线
-
- 通道的中点— 一种局部“公平价值”。
- 价格围绕此线波动表示平衡;强烈远离通常预示着测试对侧带。
- 突破点
-
- 箱体下方的绿色点:
-
- 价格已强势收盘于通道顶部之上(或简单收盘于其上,视仅强收盘而定)。
- 表明看涨突破— 潜在的波动率挤压后上涨开始。
- 箱体上方的红点:
-
- 价格已强势收盘于通道底部之下。
- 表明看跌突破— 潜在的下跌开始。
- 典型使用方法(理念层面)
-
- 趋势跟随突破
-
- 顺着突破方向交易(绿色点后买入,红色点后卖出),最好与更高时间框架趋势或其他指标配合。
- 过滤与确认
-
- 仅将通道及其突破用作过滤器,配合现有策略使用(例如仅在最后信号为看涨突破时做多)。
- 风险设置
-
- 对于看涨突破,许多交易者将止损设置在前通道内部或稍下方;对于看跌突破,则设置在箱体内部或上方。
摘要
AI 摘要
Breakout Channels is a technical indicator designed to identify consolidation zones and signal potential price breakouts. It automatically detects price ranges where the market is coiling, marking these with a grey channel box that highlights the consolidation area. The indicator draws a red upper band indicating potential resistance, a green lower band indicating potential support, and a white dotted midline representing the channel midpoint or local fair value.
Breakout points are signaled by colored dots: a green or cyan dot below the box indicates a bullish breakout, while a red dot above signals a bearish breakout. The indicator calculates these zones by normalizing price data, measuring volatility through the standard deviation of normalized prices, and identifying volatility extremes to define channel start and duration.
Channels remain visible on the chart as historical structures even after breakouts. Users can enable nested channels to allow overlapping consolidation zones. Breakout detection uses either candle body midpoints or close prices, depending on settings, to confirm strong closes outside the channel.
Typical uses include trading in the breakout direction, filtering existing strategies, and placing risk stops near channel boundaries. The indicator supports various markets including forex, indices, commodities, stocks, and cryptocurrencies.
指标配置
客户评价
0.0
评价:0
客户评价
该产品尚无评价。已经试过了?抢先告诉其他人!
讨论
常见问答
Signal
Indices
Commodities
GBPUSD
RSI
Bollinger
Fibonacci
Scalping
AI
XAUUSD
NAS100
MACD
BTCUSD
Forex
Breakout
EURUSD
NZDUSD
Martingale
Prop
ZigZag
Supertrend
Fair Value Gap
SMC
Crypto
Grid
Stocks
ATR
USDJPY
VWAP
cTrader Store 提供的所有产品,包括交易机器人、指标和插件,均由第三方开发者提供,仅供信息参考和技术访问之用。cTrader Store 并非经纪商,不提供投资建议、个人推荐或任何未来业绩保证。


猜您喜欢


价格
42.11M
交易量
6.13M
盈利点数
230
销售
8.52K
免费安装