
说明
Volume Bubbles – cTrader 自定义指标
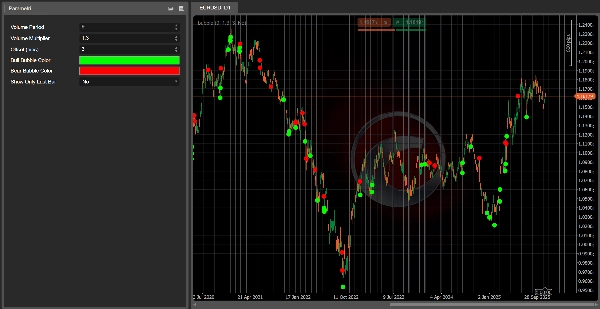
Volume Bubbles 是一个轻量但强大的 cTrader 视觉指标,直接在价格图表上突出显示具有异常成交量的蜡烛图。
无需盯着成交量直方图猜测哪些柱子真正重要,该工具会自动检测当前蜡烛的成交量是否显著高于近期平均值,并在该柱上绘制一个气泡(圆形图标):
- 对于看涨蜡烛,气泡绘制在蜡烛的最低价下方。
- 对于看跌蜡烛,气泡绘制在蜡烛的最高价上方。
这使得识别潜在的高潮走势、大玩家强烈关注的区域或趋势中的可能疲软点变得极其容易。
主要特点
- ✅ 使用成交量移动平均检测高成交量蜡烛。
- ✅ 在图表上绘制清晰的气泡(无需额外子窗口)。
- ✅ 不同颜色区分看涨和看跌成交量峰值。
- ✅ 可调节的点差偏移量以将气泡从蜡烛图中移开。
- ✅ 可选择仅在最新柱上显示气泡(适用于实时交易)。
输入参数
- 成交量周期 – 用于成交量移动平均的柱数。
- 成交量倍数 – 柱子成交量必须高于平均成交量多少倍才触发气泡。
- 偏移量(点) – 气泡与蜡烛最高/最低价之间的距离。
- 看涨气泡颜色 – 看涨蜡烛气泡的颜色。
- 看跌气泡颜色 – 看跌蜡烛气泡的颜色。
- 仅显示最后一根柱 – 如果为真,则仅在当前实时柱上显示气泡。
使用方法
将Volume Bubbles添加到您的图表,并用作视觉过滤器以:
- 确认由强成交量支持的突破。
- 发现可能的反转或疲软蜡烛
- 识别大玩家可能活跃的区域
它不是独立的交易系统,但对于任何关注成交量的价格行为或趋势跟踪策略来说,是一个极好的辅助工具。
👉 加入这里:Algotrendit Volume Bubbles
在服务器内您将找到:
- 对该及其他 cBots/指标的支持
- 策略讨论和优化建议
- 更新、新闻及我发布的未来工具
摘要
AI 摘要
Volume Bubbles is a custom indicator for the cTrader platform designed to visually highlight candles with exceptional volume directly on the price chart. It detects high-volume bars by comparing the current candle’s tick volume against a moving average of recent volumes. When a candle’s volume significantly exceeds this average, the indicator draws a colored bubble: below the low for bullish candles and above the high for bearish candles. This visual cue helps traders identify potential climactic moves, areas of strong interest from large market participants, or possible trend exhaustion points.
Key features include adjustable parameters such as the volume period for averaging, volume multiplier threshold, bubble offset in pips, and customizable colors for bullish and bearish volume spikes. Users can also choose to display bubbles only on the latest bar for real-time trading. The indicator integrates directly on the price chart without requiring additional subwindows.
Volume Bubbles serves as a visual filter to confirm breakouts supported by strong volume, spot possible reversals or exhaustion candles, and identify zones of significant market activity. It complements price action and trend-following strategies by providing volume-based insights across various markets including forex, indices, commodities, stocks, and cryptocurrencies.
指标配置
客户评价
4.0
评价:1
5 | 0 % | |
4 | 100 % | |
3 | 0 % | |
2 | 0 % | |
1 | 0 % |
客户评价
November 24, 2025
Volume Bubble highlights candles with significantly high volume by drawing bubbles right on the price chart - simple, clever, and efficient. Great for spotting potential climactic moves, blow-offs, or breakout confirmation without diving into separate volume windows. Just remember: context matters. Alerts and built-in stats would make it even better.
讨论
常见问答
Signal
Indices
Commodities
GBPUSD
RSI
Bollinger
Fibonacci
Scalping
AI
XAUUSD
NAS100
MACD
BTCUSD
Forex
Breakout
EURUSD
NZDUSD
Martingale
Prop
ZigZag
Supertrend
Fair Value Gap
SMC
Crypto
Grid
Stocks
ATR
USDJPY
VWAP
cTrader Store 提供的所有产品,包括交易机器人、指标和插件,均由第三方开发者提供,仅供信息参考和技术访问之用。cTrader Store 并非经纪商,不提供投资建议、个人推荐或任何未来业绩保证。


价格
42.11M
交易量
6.13M
盈利点数
211
销售
8.1K
免费安装