
说明
枢轴点指标
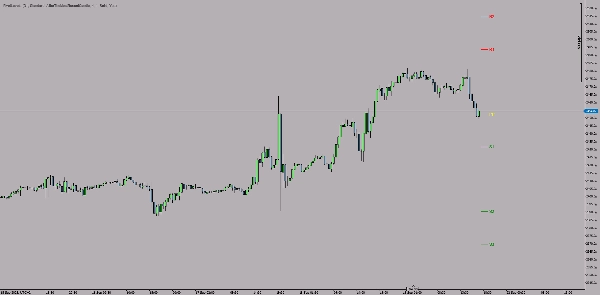
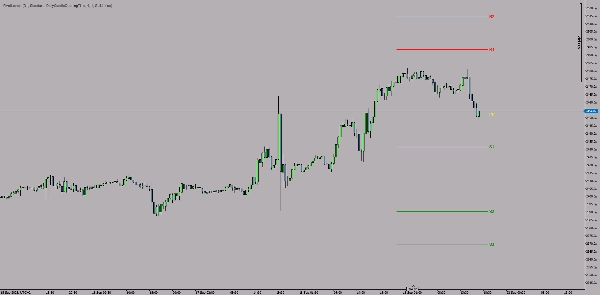
枢轴点是cTrader平台上的一个技术指标,能够自动计算并在图表上以趋势线的形式显示枢轴点。
主要特点:
🎯 枢轴类型:
- 标准枢轴点
- 斐波那契枢轴点
- 伍迪枢轴点
- 卡马里拉枢轴点
📊 水平:
- 中央枢轴点 (PP) - 黄色
- 阻力水平 (R1, R2, R3) - 红色
- 支撑水平 (S1, S2, S3) - 绿色
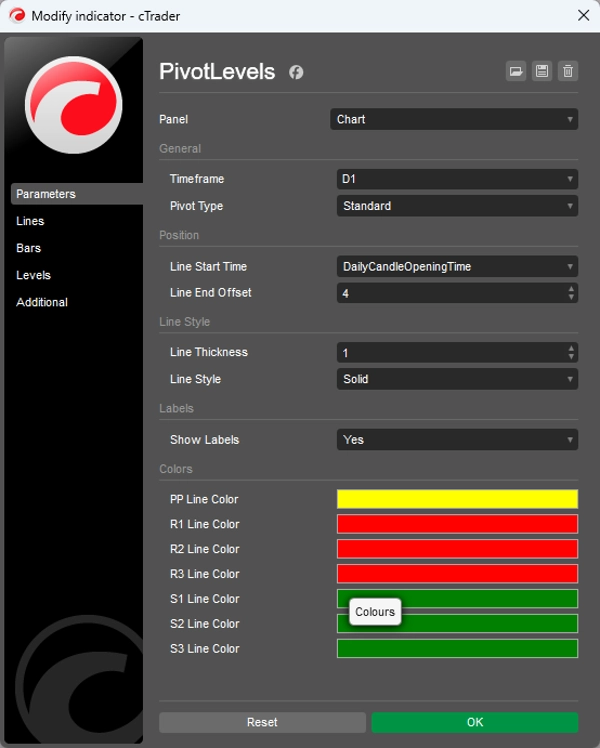
⚙️ 可自定义设置:
- 时间框架: 每日、每周或其他时间框架选择
- 线条样式: 粗细(1-5)和类型(实线、虚线等)
- 位置: 线条起始时间和长度
- 颜色: 每个水平的颜色可单独调整
- 标签: 开关文本标签显示
💡 使用方法:
该指标根据前一周期(日/周)的最高、最低、收盘(及开盘)价计算枢轴水平,识别下一交易周期的关键支撑和阻力区域。
非常适合基于技术水平应用策略的波段和日内交易者。
摘要
AI 摘要
PivotLevels is a technical indicator for the cTrader platform that automatically calculates and displays pivot points as trendlines on trading charts. It supports multiple pivot point calculation methods, including Standard, Fibonacci, Woodie, and Camarilla pivots. The indicator plots key levels such as the Central Pivot Point (PP) in yellow, resistance levels (R1, R2, R3) in red, and support levels (S1, S2, S3) in green.
Users can customize various settings, including the timeframe for pivot calculation (daily, weekly, or others), line style (thickness and type), line positioning (start time and length), colors for each level, and the option to toggle text labels on or off. The pivot levels are derived from the previous period’s high, low, close, and open prices, helping identify potential support and resistance zones for the upcoming trading period.
This indicator is suitable for traders who use technical levels in their strategies, particularly swing and day traders. It supports multiple markets such as forex, indices, commodities, cryptocurrencies, and stocks.
指标配置
客户评价
4.5
评价:2
5 | 50 % | |
4 | 50 % | |
3 | 0 % | |
2 | 0 % | |
1 | 0 % |
客户评价
September 30, 2025
The review gets easier when the decision feels less rushed, and The setup needs patience.
讨论
常见问答
Prop
Forex
Indices
Commodities
Crypto
Stocks
cTrader Store 提供的所有产品,包括交易机器人、指标和插件,均由第三方开发者提供,仅供信息参考和技术访问之用。cTrader Store 并非经纪商,不提供投资建议、个人推荐或任何未来业绩保证。


猜您喜欢


!["[Stellar Strategies] MARSI Signal Plotter" 标识](https://cdn.ctrader.com/image/webp/7b2b8da6-8f8e-4646-8d4a-4710c516c01e_25567)


价格
注册日期 05/01/2025
14
销售