
说明
🏆 10,000+ 交易者信赖我们的 25+ 算法套件! 🏆
从 市场结构与流动性 到 智能退出系统与预测工具 - 我们构建了您实现持续盈利所需的每一个工具。
👉 访问所有 25+ 经过验证的系统:
_______________________________________________
📌 市场结构指标
· ✅ 高级市场结构:Bos、Choch、SwinLevels、订单区块, 市场结构与流动性探测器
· 🔄动态市场结构转折点分析
· 🧱 订单区块
· ⚖️ 市场失衡
· ⛓️ BOS 与 CHOCH
· 🧠 ICT 三力合一
· 🌀 市场极性区
_______________________________________________
🔚 智能退出系统
· 📍 跟踪智能算法
_______________________________________________
📐 之字形指标
· 🔍 之字形价格流动性投影
· 🧭 支撑与阻力结构之字形
· ➖ 之字形
· 🎯 之字形极端追踪器
_______________________________________________
🧱 支撑与阻力指标
· 🟩 智能趋势支撑与阻力线
· 🧱 所有支撑与阻力水平
_______________________________________________
📊 趋势与通道指标
· 🔄 自动趋势通道
· 📊 超级趋势
· ⚡动量趋势分析器
· 🧠 自适应趋势通道
· 💥 通道突破系统
· 🌈 动态趋势梯度
· ⭐ 高级 SSL 通道
· 🔁 反应性移动平均线
_______________________________________________
💧 成交量与流动性工具
· 🔥 成交量 POC 热力图
· 📉 杠杆清算图
· 🔍 动量公平价值缺口
· 🕒 公平价值缺口时段
_______________________________________________
⚡ 动量与 RSI 指标
· 📈 RSI 趋势触发器
· 🚀 动态范围动量
· 🔎 多级蜡烛偏向
追踪器
_______________________________________________
🔮 预测与投影工具
· 📐 基于线性回归与 ATR 的预测
· 📏 斐波那契线性回归多时间框架
· 📈 成交量驱动的市场流动投影器_________________________
_________________________________________________________________________________________________
_________________________________________________________________________________________________
ZigZag Structure Pro – 🚀
自动识别市场的重要转折点 (关键高点和低点)并 绘制实时更新的动态支撑和阻力区。🎯 与传统静态水平不同,该指标 不断适应变化的价格结构。
它的用途是什么? ❓
该指标是一款专业的技术分析工具,旨在:
- 识别机构级别: 🏛️ 自动检测价格形成重要高低结构的点位。
- 市场结构分析: 📊 根据多头/空头结构方法论(更高高点、更低低点等)分类每一次运动。
- 趋势投影: 🔮 将趋势线延伸至未来,预测潜在的价格反应区。
- 交易反转与延续: 💰 标记的水平作为入场、止损和盈利目标的参考。
指标在您的图表上绘制: ✍️
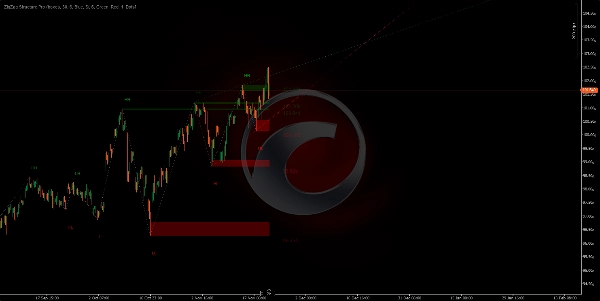
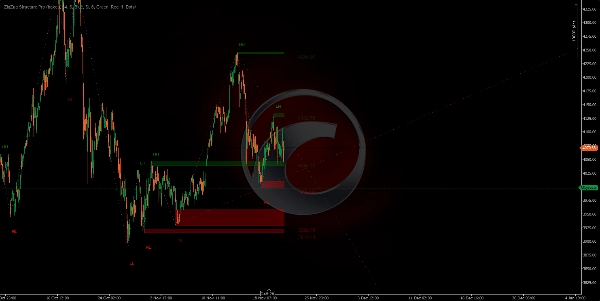
1. 支撑/阻力区(矩形)
- 绿色区域: 🟢 标记 支撑区域 (价格可能反弹的重要低点)。
- 红色区域: 🔴 标记 阻力区域 (价格可能回落的重要高点)。
- 这些区域被 向前投影,显示当前活跃水平。
- 每个区域的 厚度代表形成枢轴的蜡烛实体。
https://chartshots.spotware.com/c/691f5a4d75ac4
https://chartshots.spotware.com/c/691f6b4f2e98b
https://chartshots.spotware.com/c/691f6c6fda808
https://chartshots.spotware.com/c/691f6d0aa6155
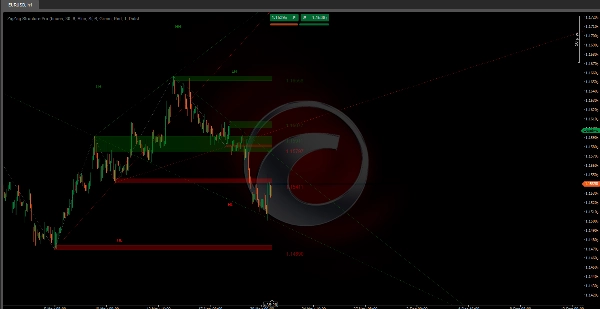
2. 连接线 ⚡
- 连接每个枢轴与下一个,形成视觉上的“之字形”图案。
- 消除市场噪音,仅显示真正重要的波动。
- 让您一目了然地看到 趋势的方向和结构。
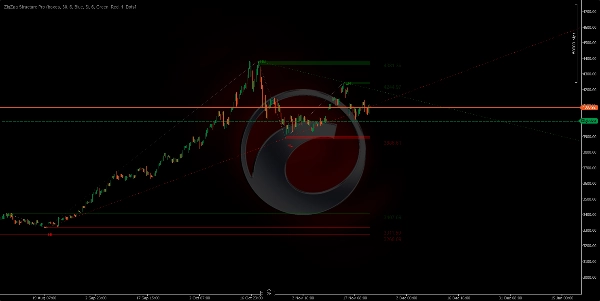
3. 投影趋势线(延伸的绿色/红色)
- 从前一个枢轴绘制到当前枢轴,并 延伸至未来。
- 绿色: 🟢 多头趋势线(从低点)。
- 红色: 🔴 空头趋势线(从高点)。
- 显示 最近两个活跃的趋势线。
- 有助于检测 趋势突破或支撑。
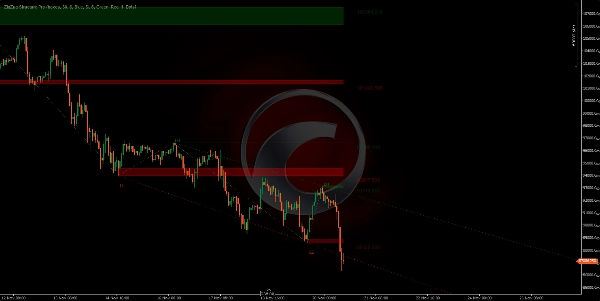
4. 市场结构标签 🏷️
每个枢轴显示一个标签,指示其分类:
- HH(更高高点): ↗️ 更高高点 - 多头延续。
- LH(更低高点): ⬆️ 更低高点 - 可能的空头反转。
- HL(更高低点): ⬇️ 更高低点 - 可能的多头反转。
- LL(更低低点): ↘️ 更低低点 - 空头延续。
算法背后的逻辑 🧠
该指标使用自适应之字形算法,具体为:
- 扫描价格,在可配置周期内寻找高点和低点(默认 34 根柱)。
- 过滤不显著的波动 通过最小偏差阈值(默认 6 点)。
- 验证每个枢轴 确保其代表市场结构的真实变化。
- 比较连续枢轴之间的结构以分类运动类型。
- 动态更新区域 随着新枢轴出现,移除最旧的。
主要设置 ⚙️
- 枢轴回溯柱数: 控制枢轴检测器的灵敏度(数值越低枢轴越多,数值越高仅显示主要枢轴)。
- 价格偏差过滤器: 噪音过滤 - 小于此值的波动将被忽略。
- 最大可见区域数: 保持可见的历史水平数量(1 到 20 之间)。
- 区域显示类型: 选择矩形(完整区域)或简单线条。
- 显示延伸趋势线: 启用/禁用趋势投影。
快速参数指南 📖
枢轴回溯柱数 (默认:30)
- ↑ 增加 (40-100): 枢轴更少,更重要。适合 波段交易。
- ↓ 减少 (15-25): 枢轴更多,信号更多。适合 剥头皮/日内交易。
价格偏差过滤器 (默认:6)
- ↑ 增加 (8-15): 过滤噪音,仅保留大幅波动。信号更少,质量更高。
- ↓ 减少 (2-5): 更灵敏,捕捉小幅波动。信号更多。
最大可见区域数 (默认:6)
- ↑ 增加 (10-20): 更多历史水平可见。适合深入分析。
- ↓ 减少 (2-4): 仅显示最近水平。图表更简洁。
历史枢轴限制 (默认:200)
- ↑ 增加 (300-500): 更多历史用于计算。适合长期分析。
- ↓ 减少 (50-150): 仅显示最近结构。性能更佳。
活动投影数量 (默认:5)
- ↑ 增加 (5-10): 更多投影趋势线。
- ↓ 减少 (1-2): 仅显示主导趋势。更清晰。
显示延伸趋势线 (是/否)
- 启用: 将趋势投影至未来。
- 禁用: 仅显示历史之字形。
🎯 快速设置
- 剥头皮: 回溯 15-20 | 偏差 3-5 | 区域 3-4
- 日内交易: 回溯 25-35 | 偏差 6-8 | 区域 5-6
- 波段交易: 回溯 40-60 | 偏差 10-15 | 区域 8-12
摘要
客户评价
5 | 0 % | |
4 | 100 % | |
3 | 0 % | |
2 | 0 % | |
1 | 0 % |


