
Penunjuk Kedai Pinescriptlabs: Pinescriptlabs Kedai cBots : (cBot) Gold & BTC BreakoutSession Pivots(baru)
Struktur Pasaran Lanjutan: Bos, Choch, SwinLevels, Blok Pesanan, Pencari Struktur Pasaran & Kecairan (Baru)
Algoritma Pintar Trailing (baru)
Ramalan Berdasarkan Linreg & ATR
Sokongan &
Garis Rintangan
SmartTrend
Dinamik
Analisis Struktur Pasaran
of
Turning
Points
Fibonacci
Linear
Regression
Multi-timeframe
Pelacak
Bias Lilin
Multi-Tahap
Auto
Sokongan dan
Rintangan
Trend
Garis
Semua
Sokongan dan
Rintangan
Tahap
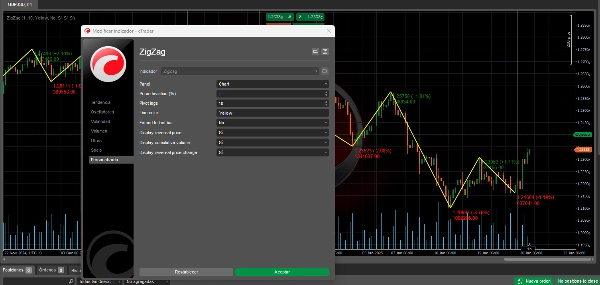
Penunjuk ZigZag: Mempermudah Trend Pasaran 📉📈
ZigZag adalah penunjuk teknikal yang membantu mengenal pasti perubahan trend penting dalam aset dengan menapis pergerakan pasaran kecil. Tujuan utamanya adalah untuk mempermudah analisis harga secara visual dengan menghapuskan "bunyi bising" daripada turun naik kecil.
Bagaimana Ia Berfungsi ⚙️
- 📊 Menganalisis harga untuk mencari titik pusingan penting (pivot).
- 📈 Titik pusingan dianggap penting apabila harga berubah dengan peratus minimum tertentu (parameter penyimpangan).
- 🔗 Menghubungkan titik pusingan ini dengan garis lurus, membentuk corak "zigzag".
- 🕒 Dikemas kini secara dinamik apabila data harga baru muncul.
Kegunaan Perdagangan 💡
Pengenalpastian Trend 📐
- 🔍 Membantu memvisualisasikan arah utama pasaran.
- 🚀 Memudahkan mengenal pasti trend menaik dan menurun.
- 📏 Menonjolkan tahap sokongan dan rintangan utama dengan jelas.
Analisis Corak 📋
- 🎯 Mempermudah pengenalpastian corak carta.
- 🕵️♂️ Menonjolkan pembentukan harga seperti segitiga, bendera, dan corak lain.
- 🌊 Meningkatkan kejelasan semasa mengenal pasti gelombang Elliott.
Pengurusan Perdagangan 🎛️
- 🎯 Mengenal pasti titik masuk dan keluar yang berpotensi.
- 🛡️ Membantu menentukan tahap stop-loss berdasarkan pivot sebelumnya.
- 🎯 Memudahkan penetapan sasaran harga yang realistik.
Analisis Volatiliti 🌡️
- 📏 Jarak antara pivot mencerminkan volatiliti pasaran.
- 🧩 Membantu menyesuaikan strategi mengikut saiz pergerakan.
- ⏳ Membezakan antara tempoh pengukuhan dan trend arah.
Pengesahan Isyarat ✅
- 🔍 Berfungsi sebagai alat pengesahan untuk penunjuk lain.
- 🚪 Mengesahkan pecahan tahap utama.
- 🔗 Boleh digabungkan dengan penunjuk lain untuk strategi yang lebih kukuh.
Pertimbangan Utama 🧠
Ia Bersifat Retrospektif 📅
- ⏪ Titik pivot hanya disahkan selepas pergerakan berlaku.
- 🔮 Ia tidak bersifat ramalan secara sendiri.
- ⚖️ Harus digunakan bersama penunjuk lain untuk membuat keputusan.
Penyesuaian Parameter 🔧
- 🎚️ Sensitiviti bergantung pada peratus penyimpangan yang ditetapkan.
- 🔍 Peratus yang lebih kecil menunjukkan lebih banyak titik pivot.
- 🧹 Peratus yang lebih tinggi menapis pergerakan kecil, hanya menunjukkan perubahan penting.
Penggunaan Jangka Masa 🕒
- 🕰️ Berfungsi pada mana-mana jangka masa.
- 🔄 Parameter harus disesuaikan berdasarkan horizon perdagangan.
- 🌐 Menganalisis merentasi pelbagai jangka masa menawarkan pandangan yang lebih menyeluruh.
📈 Gunakan penunjuk ZigZag sebagai alat yang berkuasa untuk mempermudah analisis, mengenal pasti trend, dan meningkatkan pembuatan keputusan dalam perjalanan perdagangan anda! 🚀
5 | 50 % | |
4 | 33 % | |
3 | 17 % | |
2 | 0 % | |
1 | 0 % |


