
Açıklama
Pinescritlabs Ctrader Store göstergeler :
Dynamic Market Structure
Dönüş Noktalarının Analizi
Fibonacci Linear
Regresyon Çoklu Zaman Dilimi
Multi-Level Candle Bias
Takipçi
Otomatik Destek ve
Direnç Trend Çizgileri
Tüm Destek ve
Direnç Seviyeleri
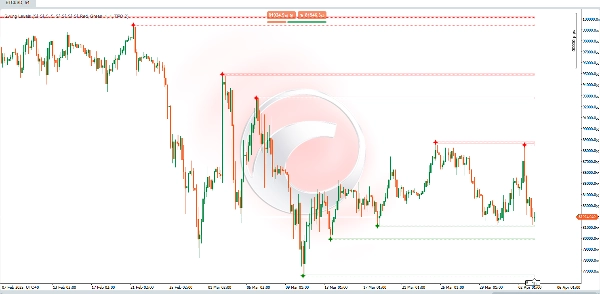
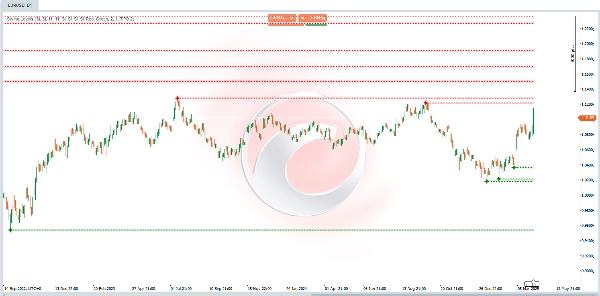
🔍 Swing Seviyeleri
Bu gösterge, grafikteki "swing" veya pivotlara (yani önemli yüksek ve düşük noktalara) dayalı olarak otomatik destek ve direnç seviyelerini tespit etmek için tasarlanmıştır. Bu noktalar belirlendikten sonra, fiyat hareketi ve ticaret kararları için ana referanslar olarak hizmet eden çizgiler veya bölgeler (dikdörtgenler) çizer.
🛠 Ana Özellikler:
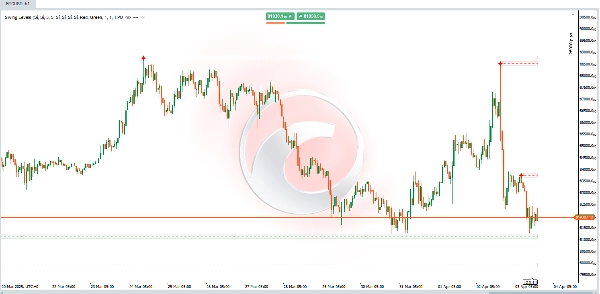
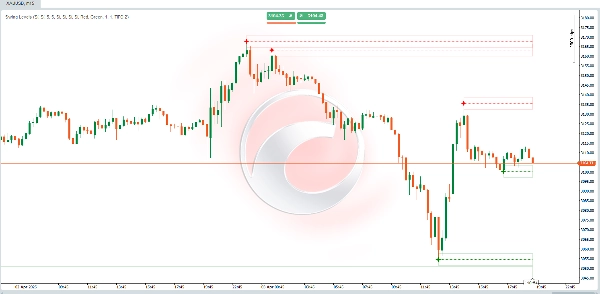
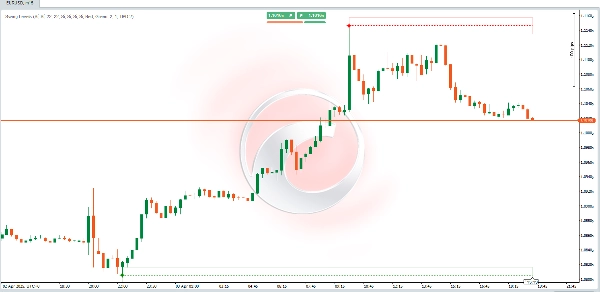
✅ Ana Seviyelerin Tanımlanması: En son swing yüksekleri ve swing düşüklerinin oluştuğu yerleri vurgular. Bu seviyeler genellikle gelecekte destek veya direnç olarak işlev görür.
✅ Piyasa Yapısı Analizi: Piyasanın daha yüksek yüksekler ve daha yüksek düşükler (boğa) veya daha düşük yüksekler ve daha düşük düşükler (ayı) oluşturup oluşturmadığını görselleştirmeye yardımcı olur — trend tanımlama ve potansiyel dönüş noktaları için önemlidir.
✅ Karar Verme Aracı: Tüccarlar, bu seviyeleri giriş noktalarını, stop-loss yerleşimlerini veya kar alma bölgelerini belirlemek için kullanabilir, dinamik destek ve dirençten yararlanabilir.
🧠 Nasıl Çalışır?
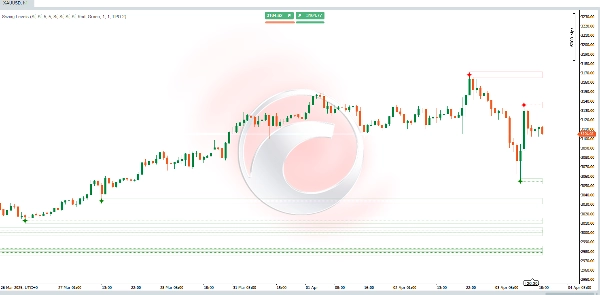
1️⃣ Pivot Tespiti (Swing Yüksek & Swing Düşük)
📌 Gösterge, tanımlı sayıda mum/barı sola ve sağa doğru analiz eder (parametreler: "Left Bars" & "Right Bars").
📌 Bir Swing Yüksek tespit etmek için, merkezi barın (potansiyel pivot) yüksekliğinin aralıktaki komşu barların yüksekliklerinden daha yüksek olup olmadığını kontrol eder.
📌 Bir Swing Düşük tespit etmek için aynı mantığı uygular ancak bunun yerine düşükleri karşılaştırır.
📊 Çizilen Seviyelerin Yorumlanması:
🔴 Swing Yüksekleri → Potansiyel Direnç Bölgeleri:
- Fiyat bu seviyeye dönerse, reddedilme (satış) veya kırılma (boğa devamı) bekleyin.
🟢 Swing Düşükleri → Potansiyel Destek Bölgeleri:
- Fiyat bu seviyeye tekrar gelirse, sekme (alış) veya düşüş (ayı devamı) gözlemlenir.
Özet
Key features include:
- Identification of recent swing highs and lows, which often act as future support or resistance.
- Visualization of market structure by highlighting patterns of higher highs and lows (bullish) or lower highs and lows (bearish), aiding trend recognition and reversal detection.
- A decision-making tool for traders to set entry points, stop-losses, and take-profit zones based on dynamic support and resistance.
Swing highs indicate potential resistance zones where price may reject or break out, while swing lows indicate potential support zones where price may bounce or break down. This indicator supports analysis across various markets and timeframes by providing clear visual cues of market turning points.
Müşteri değerlendirmeleri
5 | 0 % | |
4 | 100 % | |
3 | 0 % | |
2 | 0 % | |
1 | 0 % |


