
Mô tả
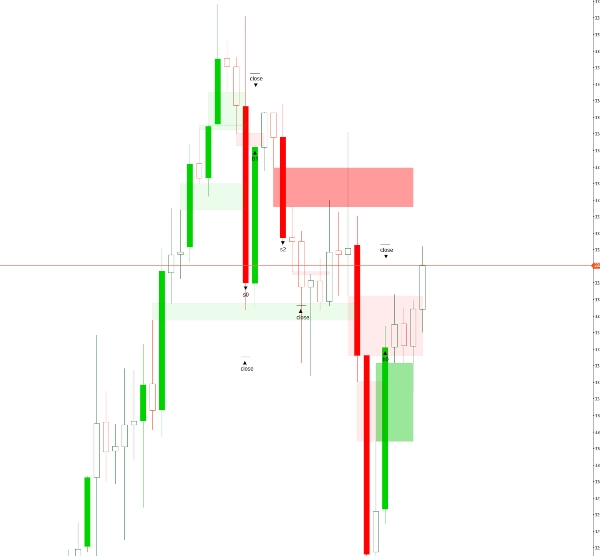
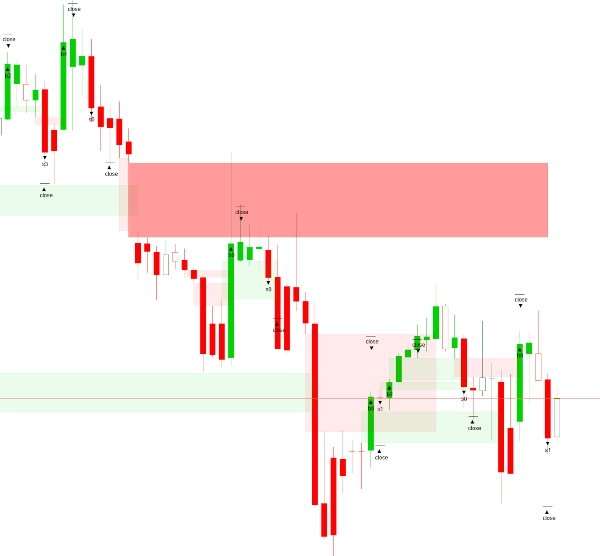
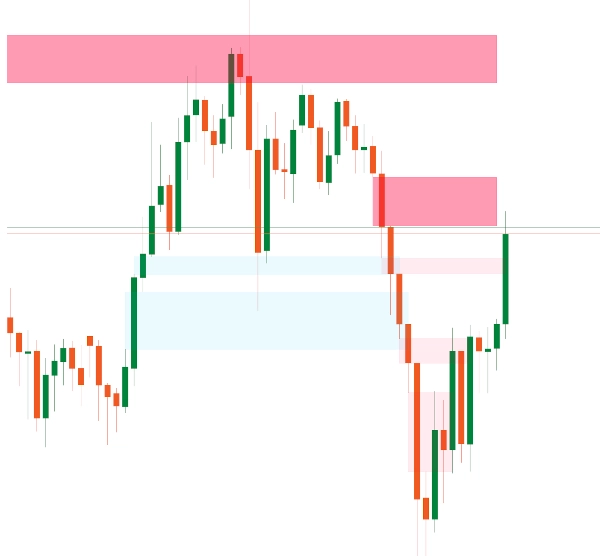
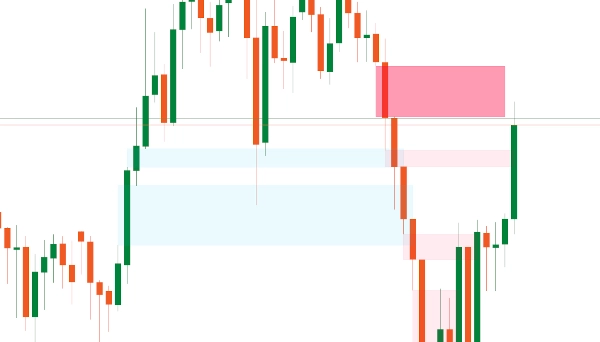
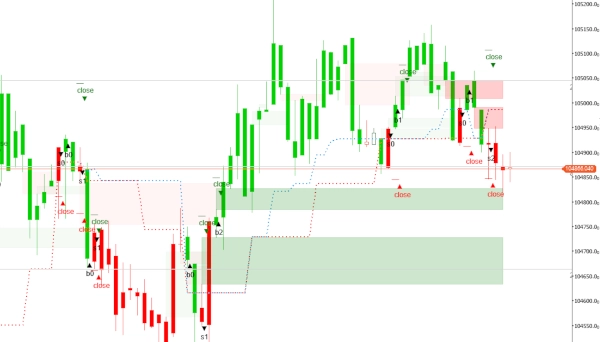
Chỉ báo Fair Value Gap (FVG) này là một công cụ phân tích kỹ thuật được thiết kế để phát hiện các bất hợp lý về giá trong các thị trường tài chính. Nó xác định các khu vực nơi giá tăng hoặc giảm nhanh chóng, để lại một “khoảng trống” — một vùng có rất ít hoặc không có hoạt động giao dịch. Những khoảng trống này thường báo hiệu sự mất cân bằng tạm thời giữa cung và cầu, gợi ý rằng giá có thể cuối cùng sẽ quay trở lại để “lấp đầy” khoảng trống khi thị trường tìm kiếm sự cân bằng. Thông thường, một FVG được nhận biết khi một cây nến giá đóng cửa đáng kể trên mức cao hoặc dưới mức thấp của cây nến trước đó mà không chồng lấn, chỉ ra một khu vực phản ứng tiềm năng. Hành vi này thường liên quan đến giao dịch tổ chức hoặc hoạt động thuật toán. Trong khi hầu hết các phiên bản của chỉ báo này phân tích sự mất cân bằng trên một khung thời gian duy nhất, phiên bản cao cấp bổ sung tính linh hoạt bằng cách phát hiện và hiển thị các khoảng trống từ các khung thời gian cao hơn hoặc thấp hơn trực tiếp trên biểu đồ hiện tại, cung cấp bối cảnh sâu hơn cho phân tích đa khung thời gian.
Tổng Quan Cài Đặt
- Số Thanh Cần Tải: Xác định số lượng thanh lịch sử để phân tích, bắt đầu từ thanh vừa hoàn thành gần nhất và đi ngược về trước.
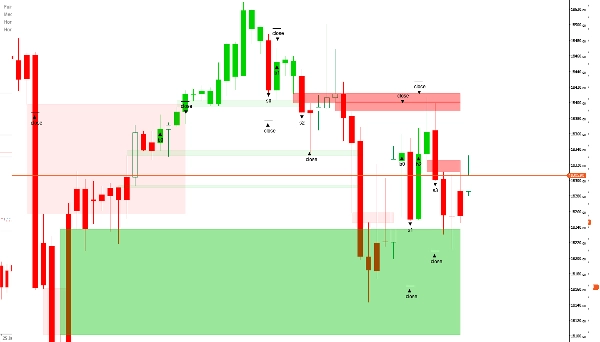
- Màu FVG Tăng: Đặt màu cho các FVG xuất hiện trong xu hướng tăng. Áp dụng độ trong suốt 30% để các phần tử phía sau khoảng trống vẫn hiển thị được.
- Màu FVG Giảm: Đặt màu cho các FVG xuất hiện trong xu hướng giảm, cũng với độ trong suốt 30% để biểu đồ dễ nhìn hơn.
Tính Năng Cao Cấp (Có trong Phiên Bản Trả Phí)
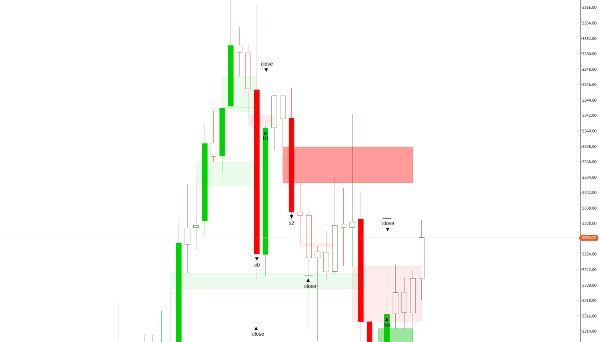
- Xóa Các Khoảng Trống Đã Đóng: Một cài đặt Boolean — khi bật ("yes"), nó tự động loại bỏ tất cả các khoảng trống đã đóng; nếu tắt ("no"), các khoảng trống vẫn hiển thị. Điều này đặc biệt hữu ích trên các khung thời gian thấp hơn (dưới 20 phút).
- Chỉnh Sửa/Xóa Khoảng Trống: Cho phép nhà giao dịch điều chỉnh hoặc xóa các khoảng trống thủ công. Điều này mang lại quyền kiểm soát lớn hơn cho các nhà giao dịch có kinh nghiệm, đặc biệt vì các khoảng trống rất nhỏ thường ít ảnh hưởng đến biến động giá.
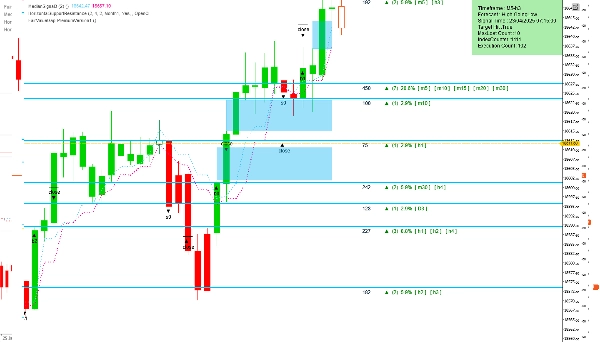
- Chọn Khung Thời Gian: Cung cấp hai lựa chọn — sử dụng khung thời gian của biểu đồ hiện tại hoặc chọn một khung thời gian khác để phân tích, trong khi vẫn hiển thị kết quả trên biểu đồ chính. Tính năng này giúp nhà giao dịch có cái nhìn nhanh hơn về các chuyển động thị trường có thể xảy ra.
- Khung Thời Gian Đã Chọn: Xác định khung thời gian mong muốn để phân tích nếu chọn "Khung Thời Gian Đã Chọn" trong cài đặt trên.
- Độ Chính Xác Khoảng Trống Nhỏ: Cho phép nhà giao dịch nhập kích thước khoảng trống ưu tiên dưới dạng số nguyên, giúp họ xác định các khoảng trống mà theo lịch sử dẫn đến kết quả thuận lợi. Giá trị này dựa trên toàn bộ bộ dữ liệu và kích thước khoảng trống quan sát được của tài sản.
Theo mặc định, chỉ báo quét tất cả các mất cân bằng trong một khung thời gian duy nhất. Tuy nhiên, việc truy cập các tính năng cao cấp thông qua phiên bản FairValueGapPremium có thể nâng cao đáng kể khả năng phân tích.
Tóm tắt
This indicator detects such gaps to highlight potential reaction zones. By default, it analyzes imbalances within a single timeframe. The premium version enhances functionality by allowing detection and display of FVGs from higher or lower timeframes directly on the current chart, supporting multi-timeframe analysis.
Key settings include the number of historical bars to analyze and customizable colors for bullish and bearish gaps with transparency for chart clarity. Premium features offer options to automatically delete closed gaps, manually edit or remove gaps, select analysis timeframes independent of the chart’s timeframe, and specify gap size accuracy to focus on significant gaps.
This tool aids traders in identifying price inefficiencies and probable market reaction areas through detailed gap analysis across multiple timeframes.
Đánh giá của khách hàng
5 | 100 % | |
4 | 0 % | |
3 | 0 % | |
2 | 0 % | |
1 | 0 % |


