Este Indicador de Gráfico de Sentimentos por Barra é uma ferramenta de análise técnica que mede a força e a direção do sentimento do mercado com base em cada barra (ou cada vela). Ele examina a relação entre os preços de abertura, máxima, mínima e fechamento de cada barra para determinar se o mercado exibiu comportamento altista, baixista ou neutro durante esse período.
Normalmente, um sentimento altista é identificado quando o preço de fechamento termina significativamente mais alto que a abertura, indicando forte pressão de compra. Um sentimento baixista é detectado quando o fechamento está notavelmente mais baixo que a abertura, sinalizando forte pressão de venda. Barras neutras, frequentemente chamadas de "dojis", refletem indecisão ou equilíbrio entre compradores e vendedores.
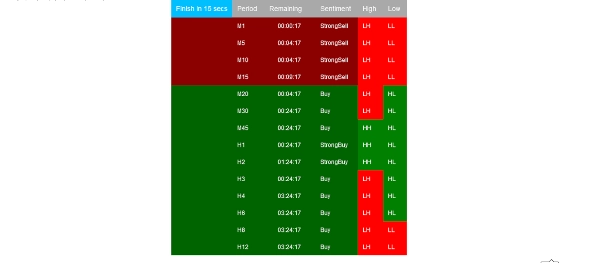
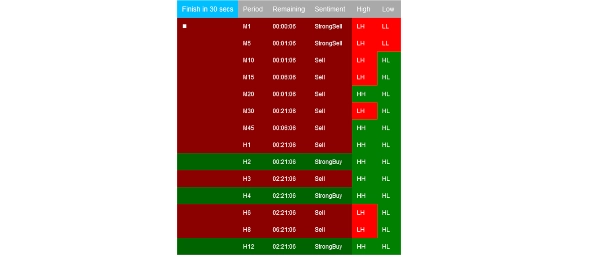
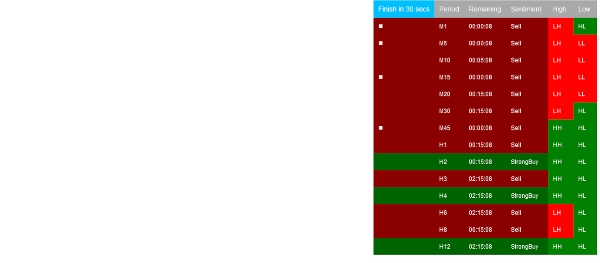
Versões avançadas do Indicador de Sentimentos por Barra podem incorporar elementos adicionais como volume, tamanho relativo do corpo ou momentum para refinar a classificação do sentimento. Os sentimentos são frequentemente visualizados por meio de codificação por cores—verde para altista, vermelho para baixista e cinza ou azul para neutro—facilitando a avaliação rápida do tom predominante do mercado.
Se 1s e 0s são os blocos fundamentais da engenharia de software, então a saída do Indicador de Gráfico de Sentimentos por Barra representa os blocos fundamentais dos sistemas avançados de negociação por aprendizado de máquina. Ao quantificar o sentimento bruto do mercado, ele fornece entradas essenciais para algoritmos que buscam aprender e prever movimentos futuros de preços com base no comportamento histórico.
Usando o Indicador de Gráfico de Sentimentos por Barra, os traders obtêm uma compreensão mais profunda da dinâmica micro do mercado, ajudando-os a identificar a força da tendência, potenciais reversões e períodos de consolidação—especialmente quando combinado com análise de múltiplos prazos e outras ferramentas técnicas.
5 | 100 % | |
4 | 0 % | |
3 | 0 % | |
2 | 0 % | |
1 | 0 % |