설명
SR Commander
무료 체험 빅 브라더: SR Commander 다중 타임프레임 https://ctrader.com/products/3833?u=ALGO-XL
SR Commander는 cTrader용으로 제작된 깔끔하고 지능적인 지지 및 저항 지표로, 트레이더가 주요 시장 수준을 식별하고 가격 위치를 즉시 파악하며 돌파, 붕괴 및 반전 시나리오에 더 빠르게 대응할 수 있도록 도와줍니다.
불필요한 잡음으로 차트를 복잡하게 만드는 대신, SR Commander는 가장 중요한 것에 집중합니다: 현재 가격 주변의 가장 가까운 실행 가능한 지지 및 저항 수준과 시장이 매수, 매도, 또는 대기 상태인지 알려주는 간단한 시각적 상태 시스템을 결합합니다.
이로 인해 매번 차트에 수동으로 수준을 표시하지 않고도 빠르고 체계적인 시장 행동 관점을 원하는 트레이더에게 특히 유용합니다.
SR Commander 작동 방식
SR Commander는 최근 가격 움직임을 스캔하고 선택된 되돌아보기 논리 내에서 가장 중요한 캔들을 식별합니다. 이를 변동성 기반 계산과 결합하여 현재 시장 가격 주변에 의미 있는 지지 및 저항 수준을 구축합니다.
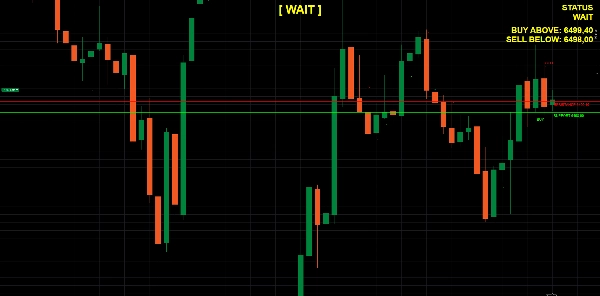
감지된 수준 중에서 지표는 자동으로 가격 아래의 가장 가까운 지지와 가격 위의 가장 가까운 저항을 선택합니다. 이 수준들은 차트에 명확한 수평선으로 직접 그려져 가격이 현재 시장 구조 내 어디에 위치하는지 즉시 이해할 수 있게 합니다.
이 수준들이 설정되면 SR Commander는 현재 시장 상태를 평가합니다:
- 매수 / 돌파
가격이 조정 가능한 돌파 버퍼와 함께 가장 가까운 저항선 위에서 마감되면, 지표는 이를 강세 돌파로 해석합니다. - 매도 / 붕괴
가격이 조정 가능한 붕괴 임계값과 함께 가장 가까운 지지선 아래에서 마감되면, 지표는 이를 약세 붕괴로 해석합니다. - 대기
가격이 지지와 저항 사이에 머무르면, 지표는 시장이 아직 범위 내에 있으며 명확한 방향성 돌파가 발생하지 않았음을 신호합니다.
이 논리는 트레이더가 감정적 의사결정을 피하고 시장 구조를 읽는 보다 객관적인 틀을 제공합니다.
실제 차트 의사결정을 위해 제작됨
SR Commander는 단순히 선을 그리는 것에 그치지 않습니다. 이는 트레이더가 그 선들에서 가격이 무엇을 하는지 이해하도록 돕기 위해 설계되었습니다.
돌파 및 붕괴 조건을 감지하는 것 외에도, 지표는 다음을 식별할 수 있습니다:
- 매수 반등 신호 가격이 지지를 테스트하고 강세 확인과 함께 다시 그 위에서 마감할 때
- 매도 거부 신호 가격이 저항을 테스트하고 약세 확인과 함께 다시 그 아래에서 마감할 때
- 과거 돌파 및 붕괴 표시기 이전 시장 반응을 차트에서 직접 검토할 수 있도록
- 선택적 과거 매수 및 매도 반응 지점 과거 지지/저항 행동을 연구하려는 트레이더를 위해
이로 인해 SR Commander는 실시간 분석뿐만 아니라 차트 검토, 패턴 인식 및 거래 기록에도 유용합니다.
깔끔한 시각 구조
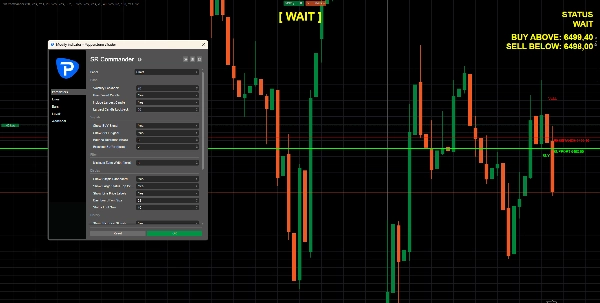
SR Commander의 강점 중 하나는 단순함입니다. 지표는 중요한 정보를 제공하면서도 시각적으로 명확하게 유지되도록 설계되었습니다.
다음 항목을 표시할 수 있습니다:
- 가장 가까운 지지 및 저항 수준
- 선 위에 선택적 가격 라벨
- 현재 시장 상태를 보여주는 컴팩트한 대시보드
- 중앙에 크게 표시되는 상태 메시지 (예: 매수, 매도, 또는 대기)
- 과거 돌파 및 붕괴 이벤트에 대한 역사적 기호
그 결과, 활발한 시장 상황에서도 읽기 쉽고 효율적인 차트가 만들어집니다.
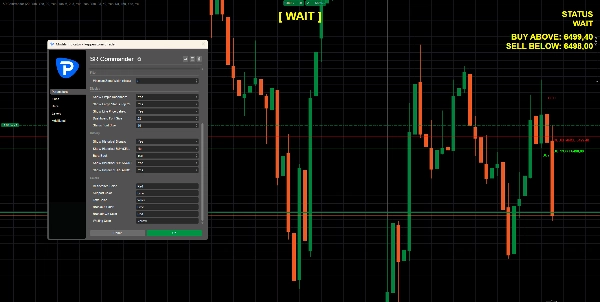
스마트 필터링 논리
SR Commander는 신호 품질을 향상시키기 위한 실용적인 필터도 포함하고 있습니다.
예를 들어, 지표는 지지와 저항 사이의 거리가 너무 좁은 상황을 무시할 수 있습니다. 현재 구역이 너무 좁아지면 시장이 너무 압축되었거나 의미 있는 의사결정을 내리기 어려울 수 있습니다. 이런 경우 지표는 낮은 품질의 신호를 강제로 내는 대신 대기 상태를 반환합니다.
이로 인해 잘못된 신호 발생이 줄어들고 더 깨끗한 거래 기회에 집중할 수 있습니다.
주요 특징
- 관련 지지 및 저항 수준을 자동으로 감지
- 현재 가격 주변의 가장 가까운 실행 가능한 수준 강조
- 돌파, 붕괴 및 대기 시장 상태 식별
- 선택적 매수 반등 및 매도 거부 신호
- 과거 돌파 및 붕괴 시각화
- 조정 가능한 돌파 버퍼 및 반등 허용치
- 선택적 폐쇄 캔들 확인 사용
- 깔끔한 대시보드 및 대형 상태 표시
- 빠른 차트 읽기를 위한 간단한 시각적 레이아웃
이 지표가 적합한 대상
SR Commander는 가격 구조 및 수준 기반 의사결정에 의존하는 트레이더에게 적합하며, 다음을 포함합니다:
- 돌파 트레이더
- 가격 행동 트레이더
- 일중 트레이더
- 스윙 트레이더
- 더 깔끔한 차트 구조를 원하는 재량 트레이더
- 지지 및 저항 주변에서 빠른 시각적 확인을 원하는 트레이더
반전, 재시험, 범위 돌파 또는 지속 움직임을 거래하든, SR Commander는 차트에서 가장 중요한 수준에 집중할 수 있도록 도와줍니다.
SR Commander를 사용하는 이유
시장이 너무 많은 지표가 주목을 끌 때 혼란스러워지는 경우가 많습니다. SR Commander는 기술 분석에서 가장 중요한 개념 중 하나인 지지 및 저항을 통해 트레이더에게 구조적이고 읽기 쉬운 시장 관점을 제공합니다.
수준 감지, 변동성 인식 논리, 반등/거부 인식 및 돌파 상태를 하나의 깔끔한 도구에 결합하여 SR Commander는 트레이더가 세 가지 필수 질문에 빠르게 답할 수 있도록 도와줍니다:
- 가격이 지금 어디에 있나요?
- 시장이 돌파 중인가요, 붕괴 중인가요, 아니면 아직 범위 내에 있나요?
- 가격이 주요 수준에서 강한 반응 또는 거부를 보이고 있나요?
이로 인해 보다 규율 있는 작업 흐름이 만들어지고 트레이더가 더 명확하고 적은 차트 잡음으로 의사결정을 할 수 있습니다.
중요 참고 사항
SR Commander는 기술 분석을 위한 의사결정 지원 도구로 설계되었습니다. 이는 승리하는 거래를 보장하지 않으며 항상 자신의 시장 맥락, 확인 방법 및 위험 관리 규칙과 함께 사용해야 합니다.
요약
SR Commander identifies breakout and breakdown scenarios when price closes beyond the nearest resistance or support levels, respectively, with adjustable buffers. It also signals buy bounces and sell rejections when price tests and reacts to these levels. Historical breakout and breakdown events are marked on the chart for review and pattern recognition.
The indicator features smart filtering to avoid low-quality signals, such as ignoring zones where support and resistance are too close. Its clean visual layout includes optional price labels, a large status message, and historical reaction points, facilitating fast and structured market analysis.
SR Commander supports traders focusing on price structure and level-based strategies, including breakout, price action, intraday, and swing trading across various markets such as forex, indices, commodities, stocks, and cryptocurrencies. It serves as a decision-support tool to enhance clarity and reduce chart noise in technical analysis.