

설명
딥 무드 분포 (DMD) 📊🧠
개요
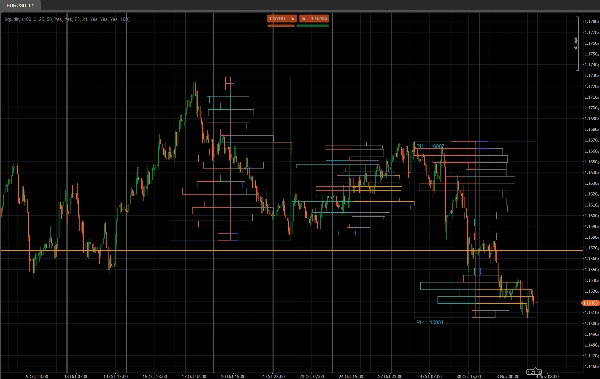
딥 무드 분포 (DMD) 는 고정된 바 블록 내 가격 움직임을 분석하는 세분화된 볼륨 프로필 및 심리 도구로 다음을 보여줍니다:
- 어디에 거래 활동이 집중되어 있는지 ⚖️
- 어디에 유동성이 얇거나 반응적인지 (잠재적 수요 및 공급 / 유동성 구역) 💧
- 각 가격 영역에서 어느 쪽이 지배적인지 (매수자 대 매도자) 🐂🐻
단일 슬라이딩 프로필 대신, DMD는 차트를 X 바의 반복 블록으로 나누고 각 블록마다 별도의 유동성 및 심리 지도를 만듭니다.
이를 통해 볼륨 분포와 시장 심리가 세그먼트마다 어떻게 변하는지 시각적으로 쉽게 비교할 수 있습니다.
작동 방식 🧩
각 Bars In Profile 캔들 블록에 대해:
- 지표는 해당 블록의 최고가와 최저가를 찾습니다.
- 가격 범위는
Number of Rows개의 수직 가격 구간으로 나뉩니다. - 블록 내 각 캔들에 대해:
-
- 틱 볼륨이 캔들의 범위가 닿는 각 가격 구간에 분배됩니다.
- 각 행에 대해 두 가지 볼륨이 누적됩니다:
-
- 해당 가격 행의 총 볼륨
- 강세 볼륨 (종가 > 시가인 바만 해당)
- 이 데이터를 바탕으로 DMD는 다음을 만듭니다:
-
- 유동성 프로필 (오른쪽)
-
- 행 길이 ∝ 블록 내 최대 행 볼륨 대비 상대적 볼륨
- 색상은 높음 / 평균 / 낮음 거래 노드를 나타냅니다.
- 심리 프로필 (왼쪽)
-
- 행별 심리 =
2 × BullishVolume − TotalVolume - 양수 = 매수자 우위 (강세 심리)
- 음수 = 매도자 우위 (약세 심리)
- 행별 심리 =
- 이 과정은 최근 N개 블록에 대해 반복되어 여러 세그먼트를 나란히 비교할 수 있습니다.
오른쪽 – 유동성 프로필 (볼륨) 📊
오른쪽 바는 각 가격 수준에서 발생한 거래 활동(볼륨)의 양을 보여줍니다 해당 블록 내에서, 매수자나 매도자 구분 없이.
- 고볼륨 노드 (HVN) – 예: 주황색 바
-
- 블록 내 최대 행 볼륨의 High Traded Threshold % 이상인 행
- 가치 영역, 활발한 거래, 통합 구역을 나타냅니다.
- 저볼륨 노드 (LVN) – 예: 파란색 바
-
- 블록 내 최대 행 볼륨의 Low Traded Threshold % 이하인 행
- 얇은 유동성 구역, 거부 가능성 또는 빠른 이동 구역을 나타냅니다.
- 평균 볼륨 노드 – 예: 회색 바
-
- 고/저 임계값 사이의 모든 것
- “보통” 거래 수준, 극단적이지 않음.
🧠 바 길이 (오른쪽)
→ 블록 내 최대 볼륨 대비 해당 가격 행의 총 거래량에 비례합니다.
거래량이 많을수록 바가 길어집니다.
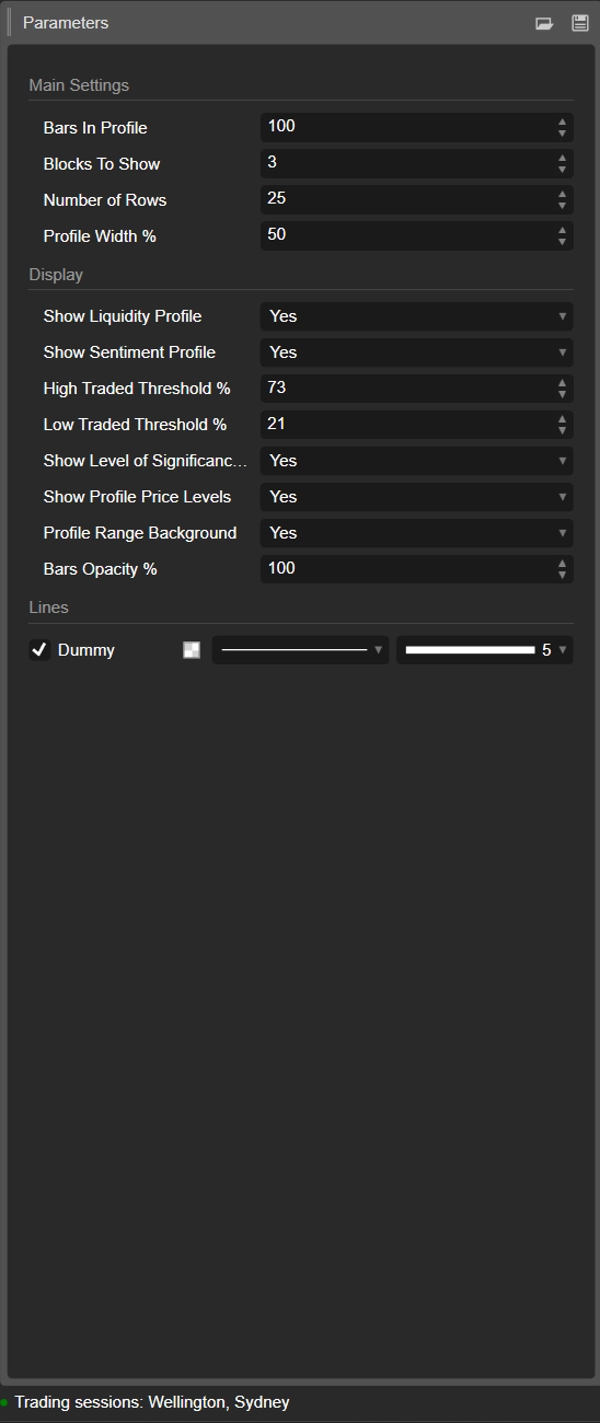
주요 매개변수:
High Traded Threshold %Low Traded Threshold %
왼쪽 – 심리 프로필 (시장 심리) 🧠📉📈
왼쪽 바는 각 가격 수준에서의 심리 / 지배력을 보여줍니다: 해당 행에서 매수자와 매도자 중 누가 더 강했는지.
각 행에 대해:
심리=2×강세볼륨−총볼륨
- 강세 바 (매수자 우위) – 예: 청록색/녹색 바
-
- 심리 > 0
- 해당 가격에서 강세 캔들(종가 > 시가)에서 더 많은 거래량이 발생했습니다.
- 해당 가격 행에서 매수 측 지배력을 나타냅니다.
- 약세 바 (매도자 우위) – 예: 빨간색 바
-
- 심리 < 0
- 해당 가격에서 약세 캔들(종가 < 시가)에서 더 많은 거래량이 발생했습니다.
- 매도 측 지배력을 나타냅니다.
🧠 바 길이 (왼쪽)
→ 블록 내 가장 강한 행에 대한 심리 절대값(|심리|)에 비례합니다.
더 강한 지배력 (매수자와 매도자 간 큰 불균형) → 더 긴 바.
주요 매개변수:
Show Sentiment Profile(켜기/끄기)
매개변수 세부사항 ⚙️
1. Bars In Profile
그룹: 주요 설정
각 블록에 포함된 캔들 수입니다.
- 예:
Bars In Profile = 100 -
- 블록 0 → 최근 100 바
- 블록 1 → 이전 100 바
- 블록 2 → 그 이전 100 바, 계속 이어짐.
블록을 다음과 맞추는 데 사용하세요:
- 대략적인 세션,
- 일반적인 스윙 / 일중 범위,
- 또는 분석하려는 임의의 창.
값이 작을수록 반응이 빠르고 더 세분화됩니다.
값이 클수록 더 부드럽고 “거시적” 구조가 됩니다.
2. Blocks To Show
그룹: 주요 설정
차트에 그릴 연속 블록 수입니다.
1→ 가장 최근 블록만 표시2–3→ 비교에 매우 실용적이며 복잡하지 않음- 더 높은 값 → 더 많은 기록, 그러나 차트 내 객체도 증가
이 값을 초과하는 오래된 블록은 안정성 유지를 위해 자동으로 정리됩니다.
3. Number of Rows
그룹: 주요 설정
각 블록 프로필의 수직 해상도입니다.
블록의 가격 범위는 이만큼의 행(가격 수준)으로 나뉩니다.
- 값이 높을수록 더 세밀하고 얇은 행, 더 많은 사각형
- 값이 낮을수록 더 부드러운 구조, 읽기 쉬움
일반적인 범위:
15–25일반적인 일중 사용30–40+매우 세밀한 해상도가 필요하고 플랫폼이 충분히 강할 때만
4. Profile Width %
그룹: 주요 설정
프로필이 블록 중심에서 수평으로 얼마나 확장되는지를 블록 너비의 백분율로 제어합니다.
- 유동성(오른쪽)과 심리(왼쪽) 모두에 영향을 미칩니다.
- 백분율이 높을수록 프로필이 주변 바까지 더 확장됩니다.
- 백분율이 낮을수록 블록 중심에 가까운 컴팩트한 프로필입니다.
권장 시작 값: 35–50%.
5. Show Liquidity Profile
그룹: 표시
각 블록 오른쪽의 볼륨 분포(유동성 프로필)을 켜거나 끕니다.
- 켜기 ✅
-
- 각 행의 길이는 해당 가격 수준에서의 상대 거래량을 반영합니다.
- 색상은 높음 / 평균 / 낮음 거래 노드를 인코딩합니다.
- 끄기 ❌
-
- 심리(활성화된 경우)만 표시되고 오른쪽에 볼륨 바는 표시되지 않습니다.
6. Show Sentiment Profile
그룹: 표시
각 블록 왼쪽의 심리 프로필을 켜거나 끕니다.
- 켜기 ✅
-
- 행은 다음과 같이 색칠됩니다:
-
- 강세 (매수자 우위) – 예: 청록색/녹색
- 약세 (매도자 우위) – 예: 빨간색
- 행 길이는 지배력 강도를 반영합니다.
- 끄기 ❌
-
- 순수 유동성/볼륨 분포만 표시됩니다.
이 옵션을 사용하면 단순히 어디에서 거래량이 발생했는지뿐 아니라 누가 해당 수준에서 더 활발했는지도 볼 수 있습니다.
7. High Traded Threshold %
그룹: 표시
각 블록 내 고볼륨 노드(HVN)의 기준값을 정의합니다.
- 블록 최대 행 볼륨의 %로 표현됩니다.
- 예: 최대 행 볼륨 = 10,000; 임계값 = 70% → 7,000 이상인 행은 HVN으로 간주됩니다.
HVN은 종종 다음을 나타냅니다:
- 가치 영역,
- 통합 구역,
- 강한 포지셔닝 / 공정 가치 영역.
8. Low Traded Threshold %
그룹: 표시
블록 최대 볼륨 대비 저볼륨 노드(LVN)의 기준값을 정의합니다.
- 이 백분율 이하의 볼륨을 가진 행은 낮은 활동 구역으로 간주됩니다.
- 이들은 다음과 같은 역할을 할 수 있습니다:
-
- 얇은 유동성 구역,
- 잠재적 거부 수준,
- 또는 가격이 빠르게 통과하는 구역.
일반적인 사용 범위: 15–30%.
9. Show Level of Significance (POC)
그룹: 표시
가장 최근 블록의 중심 가격대(POC)를 표시하거나 숨깁니다.
- POC = 해당 블록에서 가장 많이 거래된 가격 행입니다.
- 해당 가격에 수평선으로 표시됩니다. 🎯
유용한 용도:
- 평균 회귀 참조,
- 일중 “공정 가격” 기준점,
- 또는 거래 관리의 핵심 수준.
10. Show Profile Price Levels
그룹: 표시
다음에 대한 텍스트 레이블을 표시합니다:
- 프로필 최고가 (PH) – 블록 내 도달한 최고 가격
- 프로필 최저가 (PL) – 블록 내 도달한 최저 가격
가장 최근 블록에 대해 레이블이 표시되며 정확한 가격 값이 포함됩니다.
다음에 적합합니다:
- 현재 범위를 빠르게 읽기,
- PH/PL 주변에 스톱/목표 설정,
- 돌파 또는 회전의 맥락 제공.
11. Profile Range Background
그룹: 표시
각 블록의 다음을 덮는 반투명 배경 사각형을 그립니다:
- 시간 범위 (시작부터 종료 바까지)
- 가격 범위 (최저가부터 최고가까지)
이것은 블록을 시각적으로 구분하고 각 범위를 돋보이게 합니다.
더 깔끔하고 미니멀한 시각을 원하면 비활성화하세요.
12. Bars Opacity %
그룹: 표시
사각형(유동성 및 심리 바 모두)의 투명도 또는 선명도를 제어합니다.
- 20–40% → 매우 연하고 배경 스타일
- 50–70% → 균형 잡힌 가시성, 캔들은 여전히 잘 보임
- 80–100% → 강하고 거의 불투명한 블록
내부적으로 이 값은 바 색상의 알파 채널(0–255)로 변환됩니다.
추천 시작 템플릿 ⭐
지수 / 선물 일중 (M5–M15)용:
- Bars In Profile: 80–120
- Blocks To Show: 2–3
- Number of Rows: ~20
- Profile Width %: 35–45
- Show Liquidity Profile: true
- Show Sentiment Profile: true
- Bars Opacity %: 50–65
요약
Key features include:
- Liquidity Profile (right side): Displays trading volume concentration at each price level within a block, highlighting high-volume nodes (HVNs), low-volume nodes (LVNs), and average-volume nodes. Bar length corresponds to relative traded volume, and colors indicate volume intensity.
- Sentiment Profile (left side): Shows buyer vs. seller dominance per price level, calculated as twice the bullish volume minus total volume. Positive values indicate buy-side control; negative values indicate sell-side control. Bar length reflects the strength of dominance, with color coding for bullish (green/teal) and bearish (red) sentiment.
- Configurable parameters: number of bars per profile block, number of blocks displayed, vertical resolution (rows), profile width, opacity, and thresholds for defining HVNs and LVNs.
- Additional display options: Point of Control (POC) line for highest volume price in the latest block, profile high/low price labels, and background shading for block ranges.
DMD supports analysis across various markets including indices, commodities, forex, and cryptocurrencies, facilitating identification of trading activity concentration, liquidity zones, and market sentiment shifts within customizable timeframes.
고객 리뷰
5 | 0 % | |
4 | 100 % | |
3 | 0 % | |
2 | 0 % | |
1 | 0 % |


!["[CB] Pivot Points Pro" 로고](https://cdn.ctrader.com/image/webp/43463c82-67b0-4f10-a4ba-901bba091d81_32594)


