Beschreibung
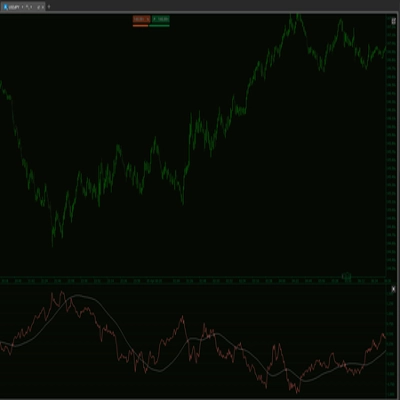
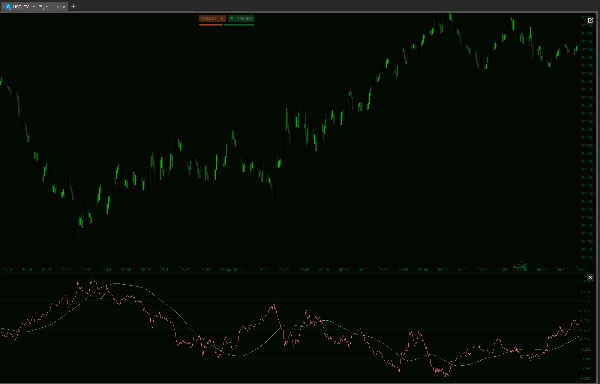
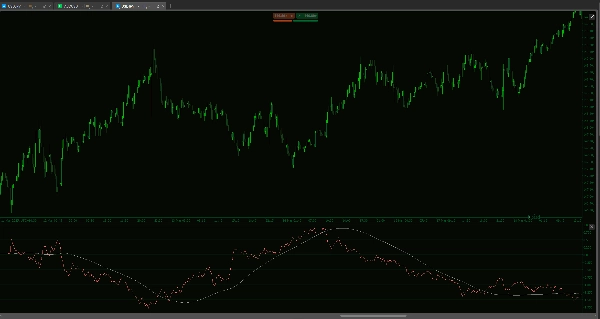
Vorstellung des Historical JXY Yen Index Indicators – das ultimative Werkzeug zur Messung der Stärke des japanischen Yen gegenüber wichtigen Währungen. Dieser fortschrittliche cTrader-Indikator synthetisiert Daten aus sechs wichtigen Yen-Paaren (EURJPY, GBPJPY, AUDJPY, NZDJPY, CADJPY, USDJPY) mit anpassbaren Gewichtungen, um ein umfassendes Echtzeitbild der Yen-Performance zu liefern.
Hauptmerkmale:
- Umfassende Währungszusammensetzung:
Integriert sechs entscheidende Yen-Paare, die jeweils gewichtet sind, um ihre Markteinwirkung widerzuspiegeln. Der umgekehrte prozentuale Änderungsmechanismus stellt sicher, dass, wenn ein Paar gegenüber dem Yen stärker wird, sein Beitrag die Gesamtleistung des Yen genau signalisiert. - Mehrschichtige Trendanalyse:
Profitieren Sie von einer Reihe von Glättungswerkzeugen, einschließlich eines optionalen SMA und zweier Hull Moving Averages (kurz- und langfristig), die Rauschen herausfiltern und echte Markttrends hervorheben, sodass Sie die Klarheit erhalten, um selbstbewusste Handelsentscheidungen zu treffen. - Anpassbar & Robust:
Passen Sie Parameter wie die Anzahl der Kerzenrückblicke, Gewichtungen und Perioden der gleitenden Durchschnitte an, um den Indikator an Ihren individuellen Handelsstil anzupassen. Optionale Sitzungsresets halten Ihre Analyse frisch und auf den Beginn neuer Handelssitzungen abgestimmt. - Umsetzbare Erkenntnisse:
Egal, ob Sie subtile Veränderungen oder große Trends verfolgen, der Historical JXY Indicator liefert die umsetzbaren Erkenntnisse, die Sie benötigen, um die Dynamik des Yen zu nutzen.
Verbessern Sie Ihre Handelsstrategie mit diesem hochmodernen technischen Werkzeug. Nutzen Sie die Kraft des Historical JXY Yen Index Indicators und verwandeln Sie komplexe Marktdaten in klare, strategische Handelsmöglichkeiten.
--------------------------
Schauen Sie sich gerne auch meine anderen Indikatoren an!
https://ctrader.com/products/1181
https://ctrader.com/products/1182
https://ctrader.com/products/1180
https://ctrader.com/products/1015
https://ctrader.com/products/555
https://ctrader.com/products/553
https://ctrader.com/products/554
https://ctrader.com/products/552
https://ctrader.com/products/557
https://ctrader.com/products/845
https://ctrader.com/products/848
https://ctrader.com/products/847
https://ctrader.com/products/846
https://ctrader.com/products/551
https://ctrader.com/products/574
https://ctrader.com/products/573
https://ctrader.com/products/556
https://ctrader.com/products/558
https://ctrader.com/products/559
https://ctrader.com/products/560
Zusammenfassung
Key functionalities include multi-layered trend analysis through smoothing tools such as an optional Simple Moving Average (SMA) and dual Hull Moving Averages (short and long term), which help filter market noise and highlight true trends. Users can customize parameters like candle lookback count, pair weightings, and moving average periods to fit their trading style. Optional session resets allow alignment with new trading sessions for up-to-date analysis.
This indicator supports actionable insights for tracking both subtle shifts and major trends in the Yen’s momentum, aiding traders in making informed decisions based on a synthesized view of multiple currency pairs.


![„[Hamster-Coder] Pivot Points MTF“-Logo](https://cdn.ctrader.com/image/webp/4c143e5a-309c-40e3-a578-f04d1e133ffa_31159)
