
Penerangan
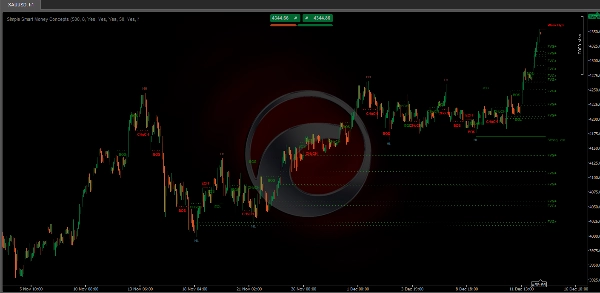
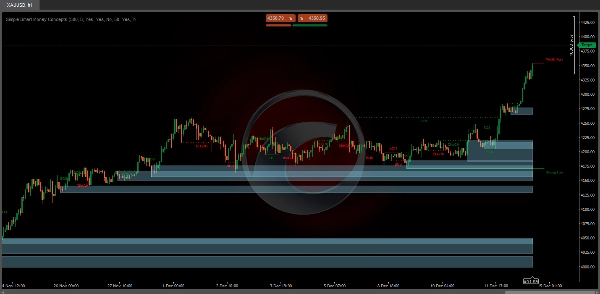
Penunjuk Konsep Wang Pintar Mudah ini memaparkan struktur pasaran masa nyata (BOS / CHoCH dalaman & ayunan), blok pesanan, zon premium & diskaun, paras tinggi & rendah yang sama, dan banyak lagi... membolehkan pedagang menandakan carta mereka secara automatik dengan metodologi tindakan harga yang digunakan secara meluas.
"Konsep Wang Pintar" (SMC) adalah istilah yang digunakan dalam kalangan pedagang tindakan harga yang mencari cara lebih tepat untuk menavigasi kecairan & mencari titik minat yang lebih optimum dalam pasaran. Mencuba menentukan di mana peserta pasaran institusi meletakkan pesanan boleh menjadi pendekatan yang sangat munasabah untuk mencari kemasukan & keluar yang lebih praktikal berdasarkan tindakan harga.
Ciri Utama
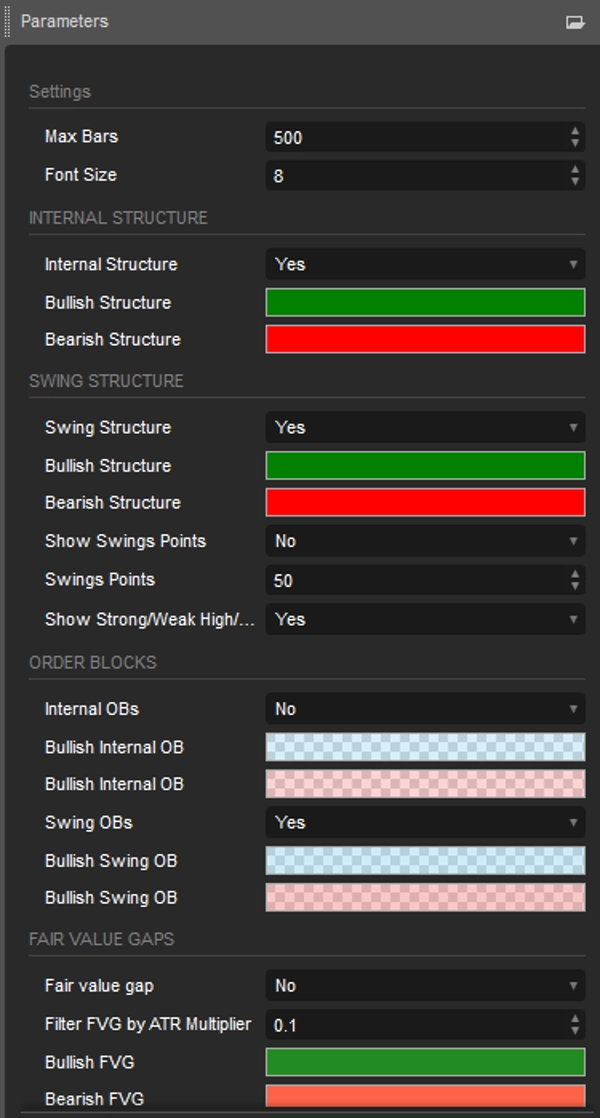
- Struktur pasaran Dalaman dan Ayunan dalam masa nyata:
-
- Struktur Dalaman: Elemen ini merujuk kepada pembentukan dan corak harga yang berlaku dalam skop yang lebih kecil atau sesi dagangan tertentu. Suite ini boleh mengesan butiran rumit seperti tahap sokongan/rintangan kecil atau pembalikan trend jangka pendek.
- Struktur Luaran: Ini melibatkan corak dan trend pasaran yang lebih besar dan penting yang merangkumi pelbagai sesi atau jangka masa. Keupayaan ini membantu pedagang memahami arah pasaran secara menyeluruh.
- Kawasan HH/LH/LL/LH:
-
- Mengenal pasti Higher Highs (HH), Lower Highs (LH), Lower Lows (LL), dan Lower Highs (LH) membantu dalam memahami trend dan struktur pasaran, menyokong analisis ramalan.
- Pecahan Struktur (BOS):
-
- Ciri ini mengenal pasti titik di mana harga memecahkan struktur penting, yang berpotensi menunjukkan trend baru atau pembalikan trend.
- Perubahan Watak (CHoCH):
-
- Mengesan perubahan halus dalam tingkah laku pasaran, yang boleh mencadangkan peringkat awal perubahan trend sebelum ia menjadi jelas kepada pasaran yang lebih luas.
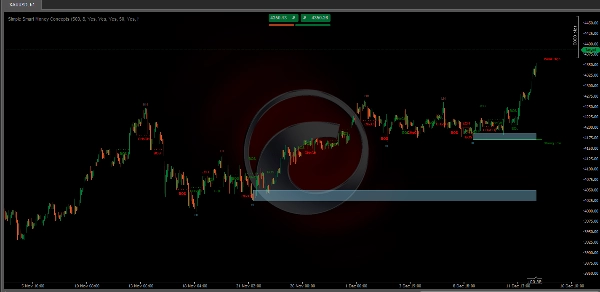
- Blok Pesanan:
-
- Ini pada dasarnya adalah tahap harga atau zon di mana aktiviti dagangan yang signifikan pernah berlaku, kemungkinan menunjukkan kedudukan wang pintar.
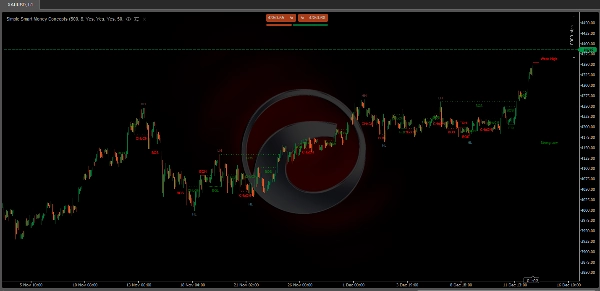
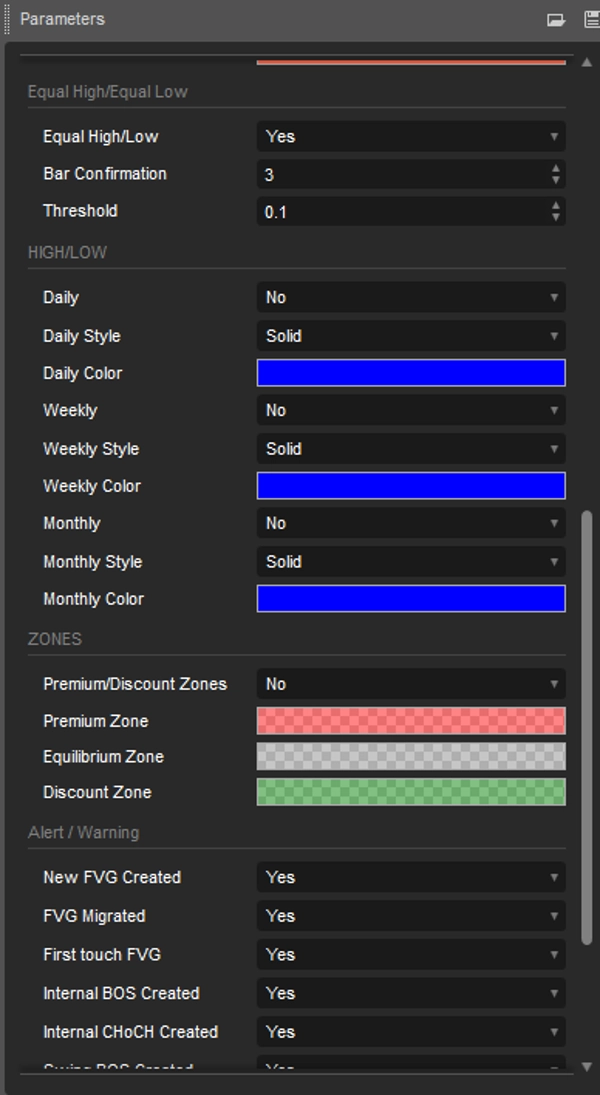
- Paras Tinggi dan Rendah Sama
-
- Memaparkan label EQH/EQL pada carta untuk mengesan paras tinggi & rendah yang sama.
- Jurang Nilai Adil:
-
- Jurang Nilai Adil: Pembentukan tiga lilin di mana bayang-bayang lilin yang bersebelahan dengan lilin tengah tidak bertindih, ini menonjolkan kawasan jurang.
- Paras Tinggi & Rendah Sebelumnya:
-
- Membenarkan pengguna memaparkan paras tinggi & rendah sebelumnya dari jangka masa harian, mingguan, & bulanan sebagai tahap penting
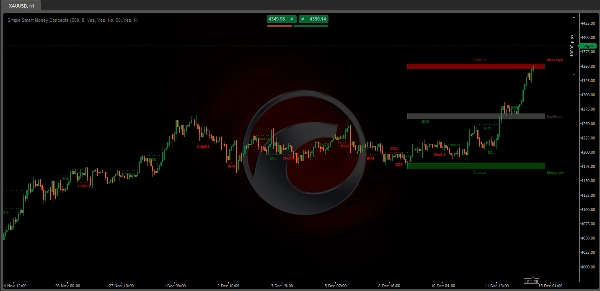
- Zon Premium & Diskaun sebagai julat:
-
- Membenarkan pengguna memaparkan zon Premium, Diskaun, dan Keseimbangan pada carta
Ciri Boleh Disesuaikan
- Pengguna boleh melaraskan tetapan seperti panjang data, warna, dan gaya paparan untuk menyesuaikan dengan keutamaan dagangan mereka.
Manfaat untuk Pedagang
- Menjimatkan masa dalam analisis manual, meningkatkan kecekapan dagangan.
- Membantu membuat keputusan cepat dan berinformasi semasa keadaan pasaran yang tidak menentu.
- Mudah digunakan untuk pemula dan pedagang berpengalaman.
Kesimpulan
Penunjuk Konsep Wang Pintar Mudah bukan sekadar alat tetapi penyelesaian menyeluruh untuk pedagang yang ingin melaksanakan strategi ICT dengan berkesan. Ia adalah pilihan kukuh untuk meningkatkan analisis pasaran dan melaksanakan dagangan yang tepat.
Ringkasan
Additional features include the identification of equal highs and lows, fair value gaps (three-candle formations indicating price gaps), and previous highs and lows across daily, weekly, and monthly timeframes. It also displays premium, discount, and equilibrium zones to help traders assess value areas.
Users can customize settings such as data length, colors, and display styles to fit their trading preferences. The indicator supports analysis across multiple markets including Forex, cryptocurrencies (e.g., BTCUSD), stocks, and commodities (e.g., XAUUSD).
Designed to streamline chart analysis, the Simple Smart Money Concepts indicator aids traders in making informed decisions by visually representing widely used price action methodologies and institutional order flow concepts.
Ulasan pelanggan
5 | 33 % | |
4 | 67 % | |
3 | 0 % | |
2 | 0 % | |
1 | 0 % |


