
Penerangan
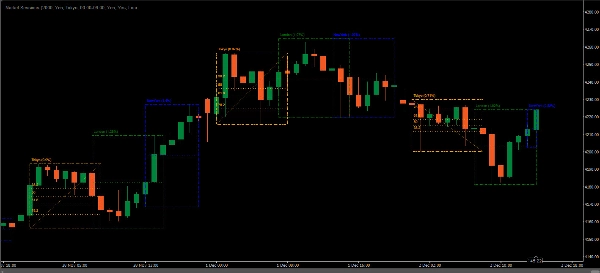
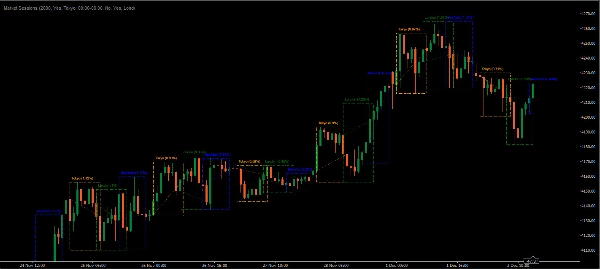
Penunjuk Market Sessions adalah alat popular di kalangan pedagang forex dan saham untuk mewakili sesi perdagangan global secara visual pada carta harga. Ia menyerlahkan tempoh masa untuk sesi perdagangan utama — seperti Asia (Tokyo), Eropah (London), dan Amerika (New York) sesi — terus pada carta. Ini membantu pedagang mengenal pasti bila pasaran dibuka dan ditutup, membolehkan membuat keputusan yang lebih baik berdasarkan tingkah laku perdagangan khusus sesi.
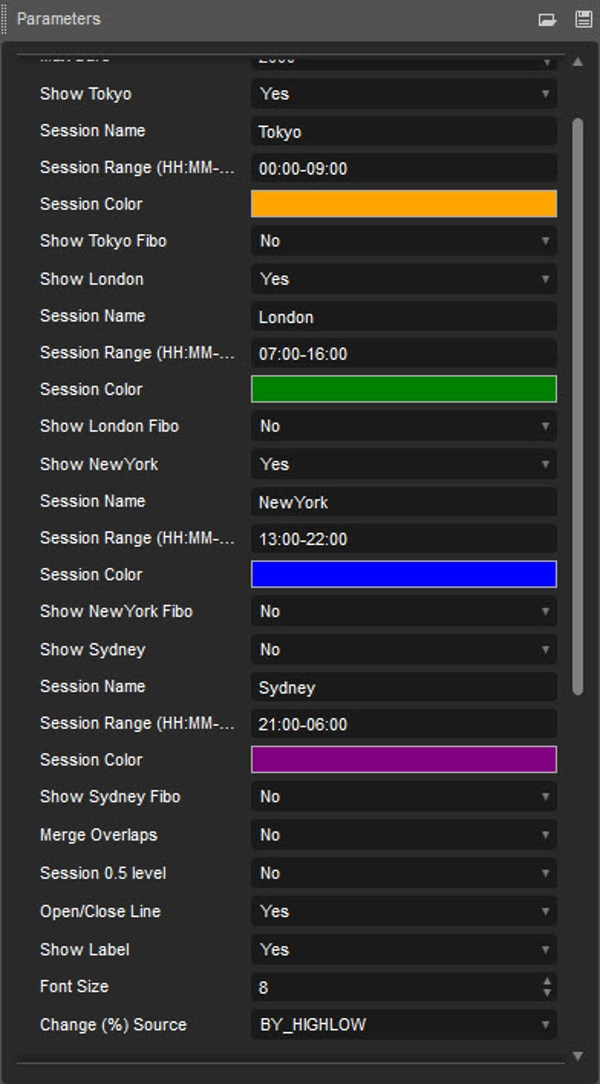
- Sesi Asia (Default: 00:00-09:00)
- Sesi London (Default: 07:00-16:00)
- Sesi New York (Default: 13:00-22:00)
- Sesi Sydney (Default: 21:00-06:00)
Ciri-ciri Utama Penunjuk Market Sessions
- Masa Sesi dan Pertindihan:
-
- Penunjuk menandakan masa mula dan tamat untuk setiap sesi. Ciri ini berguna kerana setiap sesi mempunyai ciri unik — sesi Asia, contohnya, biasanya lebih tenang, manakala sesi London sering mengalami volatiliti tinggi. Pertindihan, seperti pertindihan London-New York, juga ditandakan, menunjukkan masa aktiviti meningkat.
- Warna Sesi Boleh Disesuaikan:
-
- Pedagang sering boleh menyesuaikan warna untuk setiap sesi, yang memudahkan untuk membezakan secara visual antara sesi tersebut. Personalisasi ini menambah kejelasan dan membantu pedagang memberi tumpuan kepada sesi tertentu yang mereka mungkin sukai.
- Zon Masa Boleh Laras:
-
- Oleh kerana pedagang berada di seluruh dunia, penunjuk biasanya membenarkan pelarasan zon masa, menyelaraskan masa mula dan tamat sesi dengan masa tempatan pedagang, yang sangat berguna bagi mereka yang berada di zon masa berbeza daripada pusat perdagangan utama.
- Strategi Khusus Sesi:
-
- Setiap sesi mempunyai ciri tersendiri. Contohnya, sesi London sering kali paling tidak stabil, menawarkan peluang pecah harga, manakala sesi Asia cenderung lebih tenang, yang sesuai untuk strategi perdagangan julat. Memahami perbezaan ini membolehkan pedagang menyesuaikan strategi mereka berdasarkan tren sesi.
Mengapa Menggunakan Penunjuk Market Sessions?
- Masa Perdagangan yang Lebih Baik:
-
- Dengan mengetahui sesi mana yang aktif, pedagang boleh menyesuaikan strategi mereka untuk mengambil kesempatan daripada tahap volatiliti dan kecairan yang berbeza.
- Analisis dan Pembangunan Strategi yang Dipertingkatkan:
-
- Dengan masa sesi ditandakan secara visual, pedagang boleh menganalisis tingkah laku harga merentasi sesi untuk membangunkan dan memperbaiki strategi yang paling sesuai dengan ciri setiap sesi.
- Kesedaran yang Meningkat tentang Volatiliti Pasaran:
-
- Volatiliti sering meningkat semasa pembukaan, penutupan, dan pertindihan sesi. Penunjuk membantu meramalkan pergerakan ini, mengurangkan kemungkinan terkejut oleh perubahan pasaran yang tiba-tiba.
Contoh Kes Penggunaan
Seorang pedagang yang berminat dengan volatiliti mungkin menyasarkan tempoh pertindihan London-New York untuk mengambil kesempatan daripada pergerakan pasaran yang lebih tinggi. Dengan menggunakan penunjuk Market Sessions, mereka boleh merancang perdagangan untuk bertepatan dengan pertindihan ini, berpotensi meningkatkan peluang untuk menangkap tindakan harga yang signifikan.
Kesimpulannya, penunjuk Market Sessions adalah penting bagi pedagang yang ingin membuat keputusan berdasarkan tingkah laku pasaran khusus masa. Ia memberikan kejelasan, meningkatkan analisis, dan boleh menyokong strategi perdagangan yang lebih berkesan.
Ringkasan
Ulasan pelanggan
5 | 33 % | |
4 | 67 % | |
3 | 0 % | |
2 | 0 % | |
1 | 0 % |


