Описание
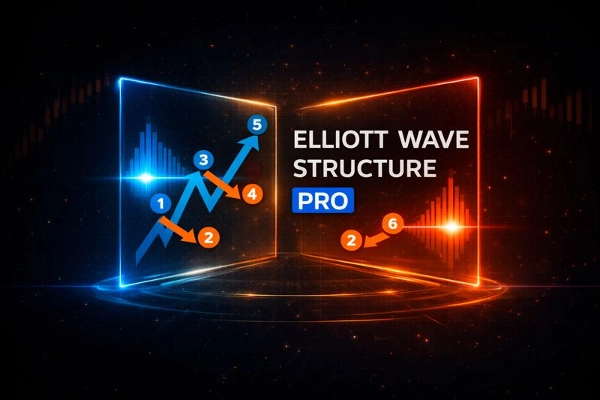
Продолжение волны Эллиотта-3 и развороты Эллиотта
Структура волны Эллиотта — это индикатор, предназначенный для анализа структуры рынка с помощью теории волн Эллиотта.
Он сочетает в себе подтверждённый анализ колебаний, структуру рынка, обнаружение импульсов Эллиотта и специальный модуль продолжения волны 2 к волне 3.
Этот инструмент создан для трейдеров, которым нужна ясность, подтверждение и выполнение по правилам, а не субъективное рисование.
Двигатель колебаний без перерисовки
Все расчёты основаны на подтверждённых точках колебаний с использованием:
- Регулируемой глубины колебаний
- Минимального отклонения цены (фильтр в пипсах)
- Баров подтверждения
Как только колебание зафиксировано, оно не меняется, обеспечивая полную историческую надёжность.
Анализ структуры рынка:
Автоматически идентифицирует и маркирует:
- Высокий максимум (HH)
- Высокий минимум (HL)
- Низкий максимум (LH)
- Низкий минимум (LL)
Обнаружение импульсов волн Эллиотта:
Индикатор автоматически обнаруживает полные 5-волновые импульсы Эллиотта в обоих направлениях:
- Бычий: L-H-L-H-L-H
- Медвежий: H-L-H-L-H-L
Он проверяет импульсы с помощью внутренних правил:
- Сила волны 3
- Логика коррекции волн 2 и 4
- Пропорциональность волны 5
Каждый импульс оценивается с помощью оценки качества (0–100) и помечается непосредственно на графике.
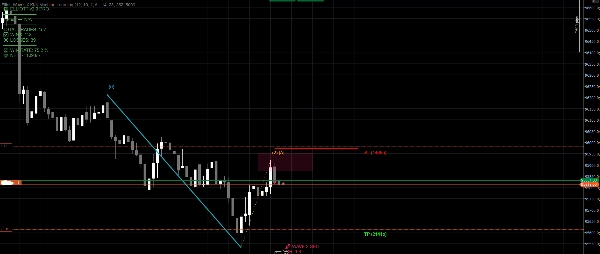
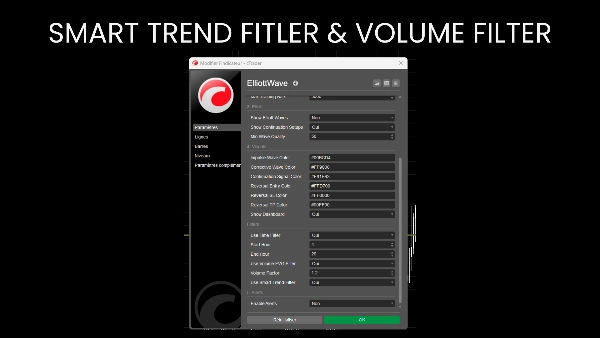
Настройка продолжения волны 3 (основной торговый модуль)
Это основной торговый компонент индикатора.
Система определяет структуры продолжения волн 0-1-2 и готовит входы для волны 3:
- Бычий: Низ → Высокий → Более высокий минимум
- Медвежий: Высокий → Низ → Более низкий максимум
Критерии проверки включают:
- Коррекция волны 2 между 23,6% и 88,6%
- Отсутствие аннулирования через волну 0
- Согласование тренда с использованием структуры рынка
- Сила волны 1 относительно ATR
- Цена должна находиться на зоне OB
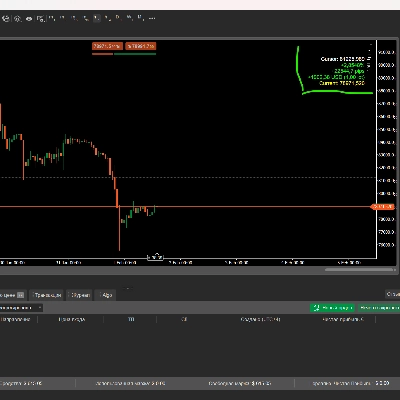
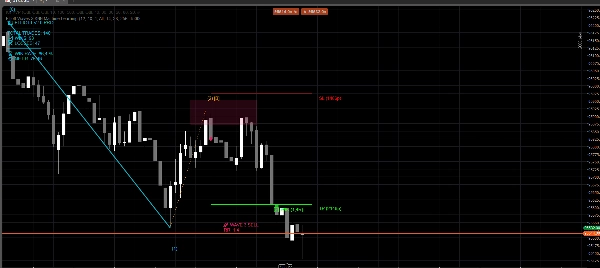
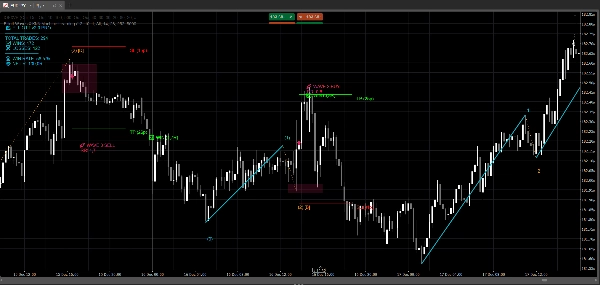
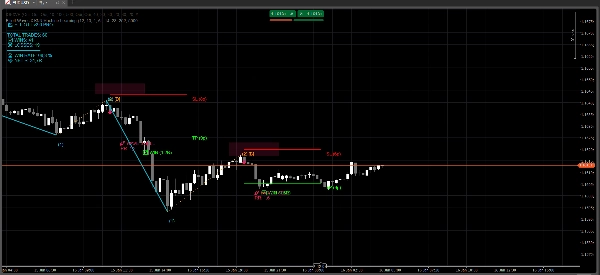
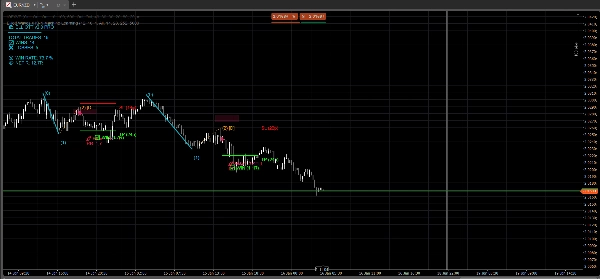
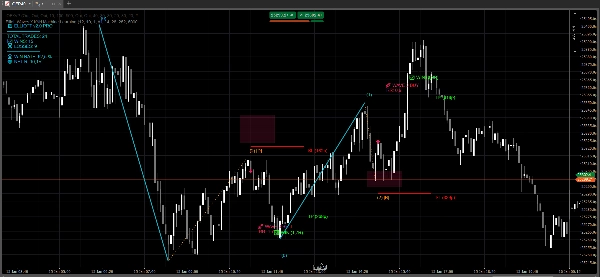
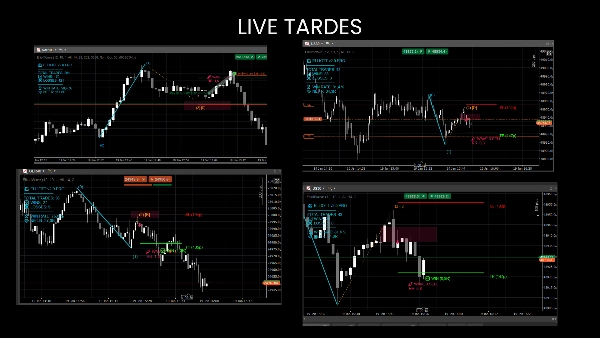
При подтверждении индикатор автоматически рисует:
- Структуру волн 1 и 2
- Зону входа OB
- Сигнал входа
- Стоп-лосс на основе ATR за пределами волны 2
- Тейк-профит на основе проекции ATR
Управление рисками и сделками
- Стоп-лосс и тейк-профит рассчитываются динамически с использованием ATR
- Соотношение риск-вознаграждение отображается непосредственно на графике
- Разработано для избежания чрезмерно растянутых или низкокачественных настроек
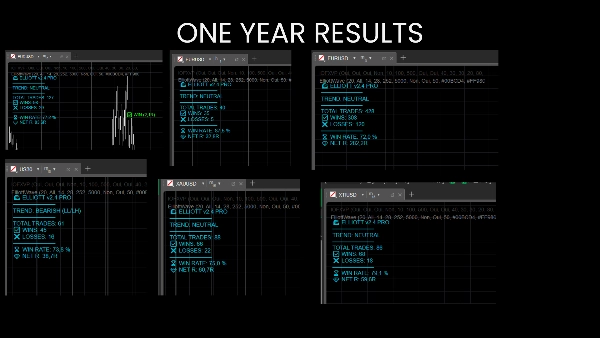
Лично я использую его для скальпинга индексов на M1 и M5, но он также работает с FX, товарами, акциями и т.д. Панель показывает, был ли он прибыльным на конкретном активе.
Бесплатная версия позволяет попробовать на основных FX M15.