
Penerangan
📈 Stochastic RSI
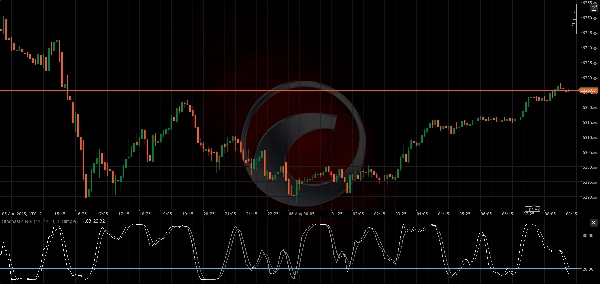
Penunjuk Stochastic RSI adalah osilator momentum yang menggunakan formula Stochastic pada nilai RSI dan bukannya harga, menjadikannya penunjuk derivatif kedua. Ia sangat berguna untuk mengenal pasti keadaan terlebih beli dan terlebih jual dengan kepekaan yang lebih tinggi berbanding RSI standard.
🛠️ Parameter
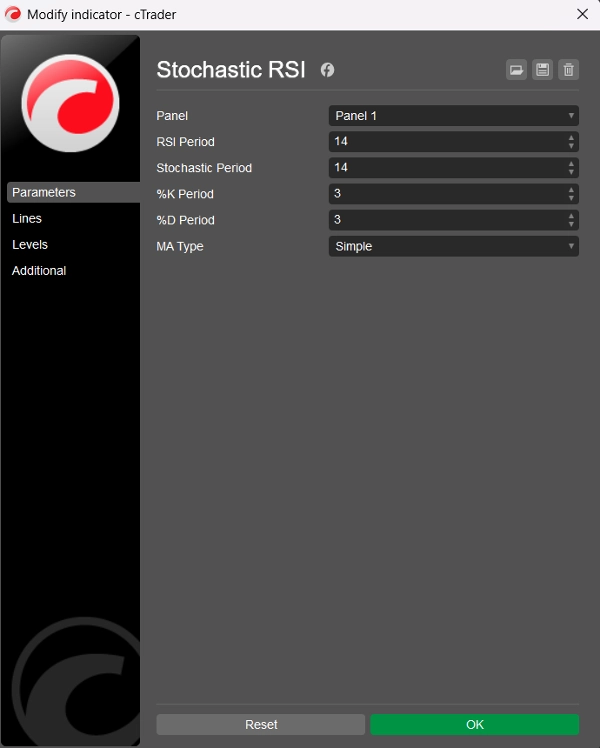
Tempoh RSI: Tempoh semakan yang digunakan untuk mengira RSI asas (lalai = 14)
Tempoh Stochastic: Tempoh semakan yang digunakan pada nilai RSI untuk mengira Stochastic RSI (lalai = 14)
Tempoh %K: Tempoh pelicinan untuk garis %K (lalai = 3)
Tempoh %D: Tempoh pelicinan untuk garis %D (lalai = 3)
Jenis MA: Jenis purata bergerak untuk pelicinan: Pilihan 11 jenis (lalai = Mudah)
📊 Garis Output
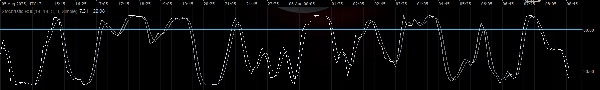
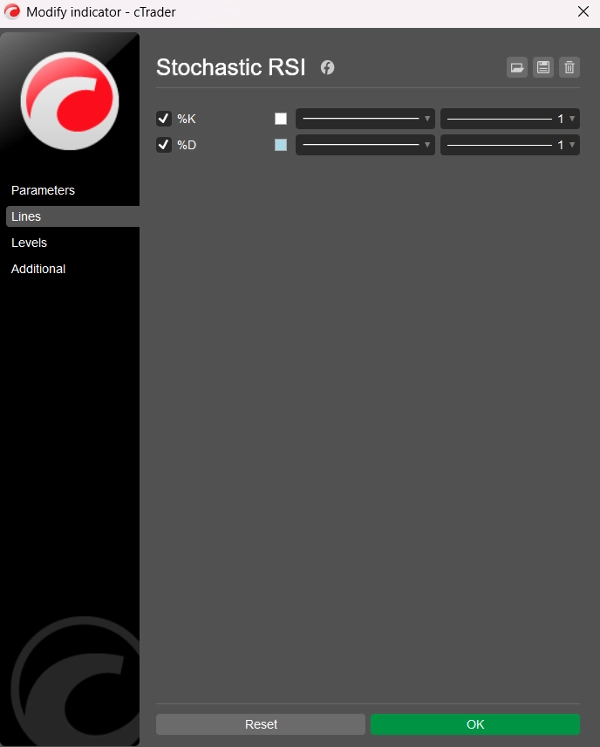
- Garis %K: Stochastic RSI yang dilicinkan (putih)
- Garis %D: Purata bergerak yang dilicinkan bagi %K (biru muda)
Kedua-dua garis berosilasi antara 0 dan 100, membolehkan bacaan terlebih beli dan terlebih jual yang jelas.
⚠️ Tahap Disyorkan
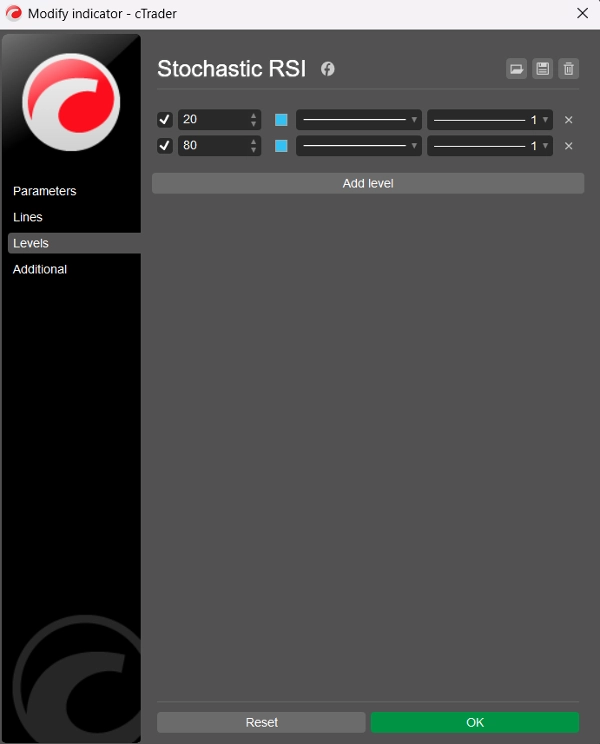
Walaupun penunjuk tidak memaparkan tahap statik secara lalai, pengguna disarankan untuk menambah ini secara manual melalui tab “Levels” dalam cTrader:
- Tahap 80 → Terlebih Beli
- Tahap 20 → Terlebih Jual
Tahap ini berfungsi serupa dengan Osilator Stochastic tradisional tetapi digunakan pada tingkah laku RSI, menjadikan isyarat lebih tajam dan sering lebih pantas.
🧠 Cara Menggunakan
- Terlebih Beli (>80): Mungkin menunjukkan harga terlalu tinggi ke atas — potensi untuk pembalikan atau pengukuhan.
- Terlebih Jual (<20): Mungkin menandakan harga terlebih jual — kemungkinan pantulan atau pembalikan tren.
- Persilangan %K dan %D: Boleh digunakan serupa dengan Stochastic atau MACD — persilangan bullish di bawah 20 atau persilangan bearish di atas 80 mungkin boleh diambil tindakan.
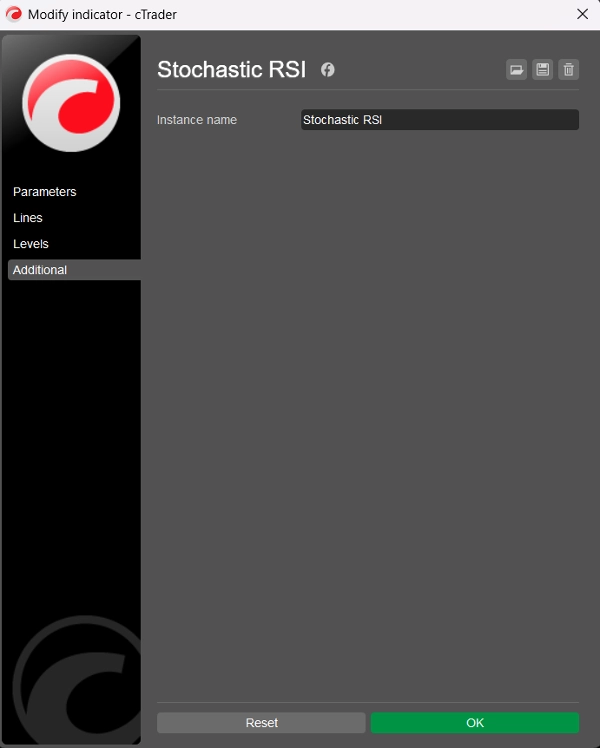
🏷️ Nota
- Dibina untuk cTrader menggunakan C# dan Automate API
- Bersih, cekap, dan boleh disesuaikan dengan 11 jenis MA
- Kod dan logik oleh BlueRocketBots & ChatGPT (OpenAI)
- Kod bersih (jumlah 99 baris; 54 baris kod, 27 baris teks, 18 baris kosong)
- Versi V2 yang dipertingkatkan
- Percuma!
Ringkasan
Key parameters include the RSI Period (default 14), Stochastic Period (default 14), %K and %D smoothing periods (default 3 each), and a choice among 11 moving average types for smoothing (default is Simple). The indicator outputs two lines: the %K line (smoothed Stochastic RSI) and the %D line (smoothed moving average of %K), both oscillating between 0 and 100.
Suggested manual levels for interpretation are 80 (overbought) and 20 (oversold). Traders may use these levels along with %K and %D crossovers to identify potential price reversals or consolidations. For example, a bullish crossover below 20 or a bearish crossover above 80 can signal actionable market moves.
The indicator is implemented in clean, efficient C# code using the Automate API, allowing customization and integration within cTrader.


