
Penerangan
Penunjuk Sokongan Rintangan Dipertingkatkan
Buka kuasa analisis teknikal dengan Penunjuk Sokongan Rintangan Dipertingkatkan kami untuk cAlgo. Alat canggih ini direka untuk membantu pedagang mengenal pasti dan memvisualisasikan tahap sokongan dan rintangan kritikal pada carta dagangan mereka, meningkatkan pembuatan keputusan dan strategi dagangan.
Ciri-ciri Utama:
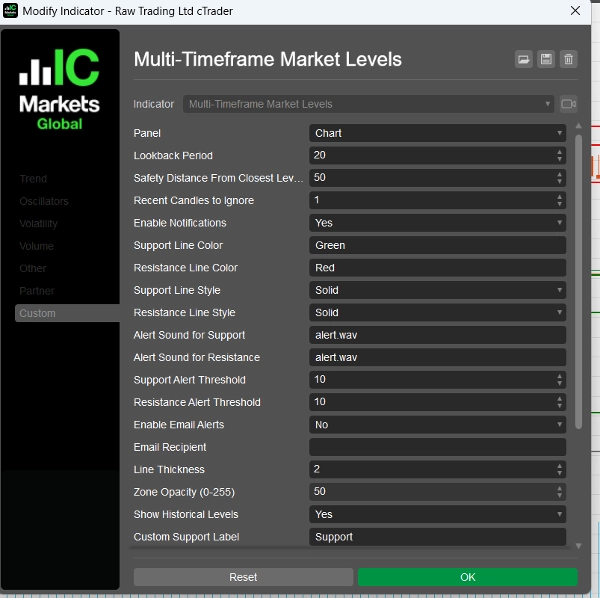
- Parameter Boleh Disesuaikan: Sesuaikan penunjuk mengikut gaya dagangan anda dengan tetapan boleh laras, termasuk tempoh tinjauan semula, jarak keselamatan, bunyi amaran, dan banyak lagi.
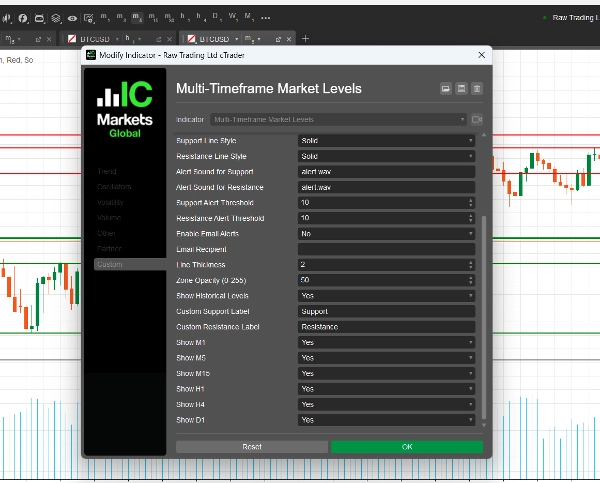
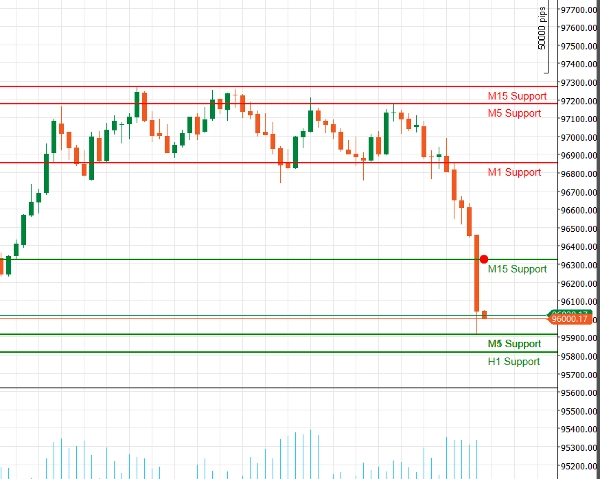
- Sokongan Pelbagai Tempoh Masa: Analisis pelbagai tempoh masa secara serentak (M1, M5, M15, H1, H4, D1) untuk mendapatkan pandangan menyeluruh tentang dinamik pasaran dan mengenal pasti tahap utama merentasi horizon dagangan yang berbeza.
- Amaran Masa Nyata: Kekal dimaklumkan dengan pemberitahuan segera! Penunjuk boleh menghantar amaran audio dan pemberitahuan e-mel apabila harga menghampiri tahap sokongan atau rintangan kritikal, memastikan anda tidak terlepas peluang dagangan.
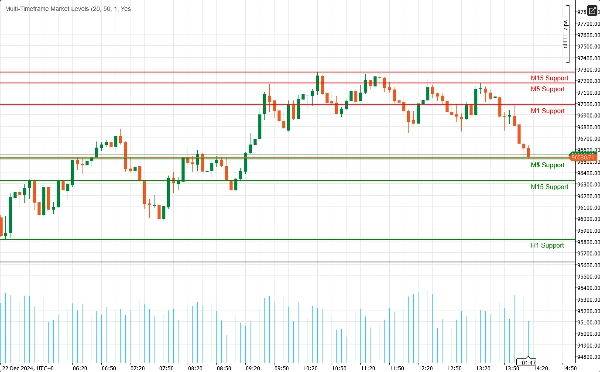
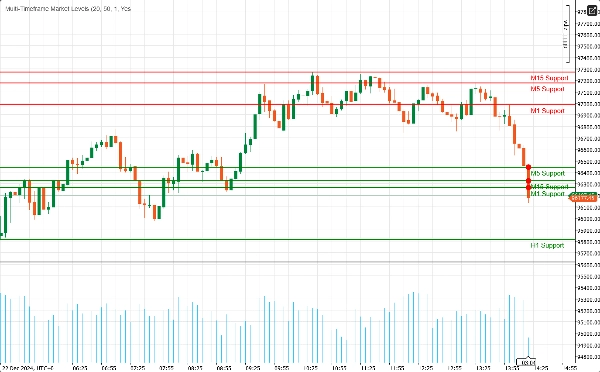
- Kejelasan Visual: Nikmati representasi visual yang jelas bagi tahap sokongan dan rintangan, lengkap dengan warna dan gaya garis yang boleh disesuaikan. Zon yang diserlahkan memberikan konteks tambahan, memudahkan untuk mengenal pasti titik pembalikan potensi.
- Integrasi Fibonacci: Tingkatkan analisis anda dengan lukisan tahap Fibonacci terbina dalam, membolehkan anda mengenal pasti tahap retracement dan lanjutan potensi bersama sokongan dan rintangan.
- Antara Muka Mesra Pengguna: Direka untuk pedagang baru dan berpengalaman, penunjuk ini mudah disediakan dan berintegrasi dengan lancar ke dalam persekitaran cAlgo sedia ada anda.
Cara Menggunakan Penunjuk Sokongan Rintangan Dipertingkatkan
- Pemasangan:
-
- Muat turun penunjuk dan import ke dalam platform cAlgo anda.
- Lampirkan penunjuk pada carta yang dikehendaki.
- Konfigurasikan Parameter:
-
- Laraskan tetapan untuk menyesuaikan gaya dagangan anda. Tetapkan tempoh tinjauan semula, jarak keselamatan, dan pilih warna serta gaya garis pilihan anda untuk tahap sokongan dan rintangan.
- Aktifkan pemberitahuan jika anda ingin menerima amaran apabila harga menghampiri tahap ini.
- Pilih Tempoh Masa:
-
- Pilih tempoh masa yang anda ingin paparkan. Anda boleh memilih untuk menunjukkan atau menyembunyikan tahap dari M1, M5, M15, H1, H4, dan D1, bergantung pada strategi dagangan anda.
- Analisis Carta:
-
- Perhatikan tahap sokongan dan rintangan yang dilukis pada carta anda. Tahap ini menunjukkan di mana harga mungkin berbalik atau mengukuh.
Cara Berdagang dengan Penunjuk Sokongan Rintangan Dipertingkatkan
- Mengenal Pasti Titik Masuk:
-
- Dagangan Panjang: Cari peluang membeli apabila harga menghampiri tahap sokongan, terutamanya jika menunjukkan tanda-tanda memantul kembali (contohnya, corak lilin bullish).
- Dagangan Pendek: Pertimbangkan untuk menjual apabila harga hampir dengan tahap rintangan, terutamanya jika terdapat isyarat bearish (contohnya, corak lilin bearish).
- Menggunakan Amaran:
-
- Manfaatkan amaran masa nyata untuk memberitahu anda apabila harga menghampiri tahap sokongan atau rintangan utama. Ini membolehkan anda bertindak dengan cepat dan memanfaatkan peluang dagangan yang berpotensi.
- Menggabungkan dengan Penunjuk Lain:
-
- Tingkatkan strategi anda dengan menggabungkan Penunjuk Sokongan Rintangan Dipertingkatkan dengan penunjuk teknikal lain (contohnya, Purata Pergerakan, RSI, MACD) untuk mengesahkan isyarat dan meningkatkan ketepatan dagangan anda.
- Menetapkan Tahap Stop-Loss dan Take-Profit:
-
- Letakkan pesanan stop-loss sedikit di bawah tahap sokongan untuk dagangan panjang dan sedikit di atas tahap rintangan untuk dagangan pendek bagi mengurus risiko.
- Tetapkan sasaran take-profit pada tahap sokongan atau rintangan penting seterusnya untuk memaksimumkan keuntungan potensi.
Mengapa Memilih Sokongan Rintangan Dipertingkatkan?
Menavigasi kerumitan pasaran kewangan boleh menjadi mencabar. Penunjuk Sokongan Rintangan Dipertingkatkan membekalkan anda dengan alat yang anda perlukan untuk mengenal pasti tahap harga utama dan membuat keputusan dagangan yang berinformasi. Sama ada anda seorang pedagang harian atau pelabur jangka panjang, penunjuk ini adalah tambahan penting kepada alat dagangan anda.
Ringkasan
Ulasan pelanggan
5 | 100 % | |
4 | 0 % | |
3 | 0 % | |
2 | 0 % | |
1 | 0 % |


