


Penerangan
MACD Pro Trader – Penunjuk Dagangan MACD Terunggul 🚀
Adakah anda mencari penunjuk MACD tahap profesional yang berkuasa untuk meningkatkan strategi dagangan anda? MACD Pro Trader adalah alat terbaik yang direka untuk pedagang yang mahukan ketepatan, kejelasan, dan isyarat berprestasi tinggi dalam keputusan dagangan mereka. Sama ada anda seorang pemula atau pedagang berpengalaman, penunjuk MACD canggih ini akan membantu anda mengenal pasti tren pasaran, mengesan setup dagangan berkemungkinan tinggi, dan memaksimumkan keuntungan anda dengan keyakinan!
🔥 Mengapa Pilih MACD Pro Trader?
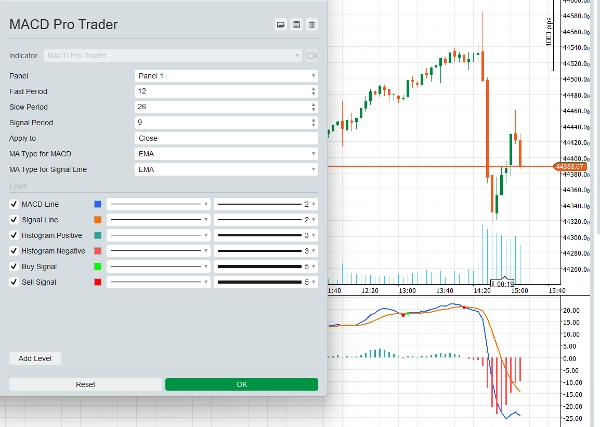
✅ Penyesuaian Purata Pergerakan Lanjutan – Pilih antara SMA (Simple Moving Average) atau EMA (Exponential Moving Average) untuk kedua-dua garis MACD dan garis Isyarat, memberi anda kawalan penuh ke atas bagaimana penunjuk menyesuaikan diri dengan keadaan pasaran yang berbeza.
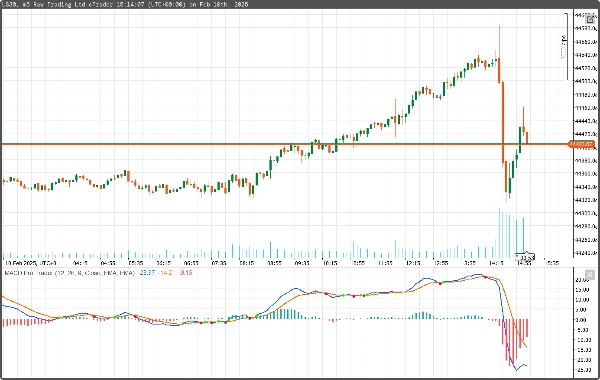
✅ Isyarat Beli & Jual Pintar – Dapatkan isyarat masuk dan keluar yang jelas dengan penanda hijau dan merah yang berbeza secara visual yang menunjukkan bila garis MACD melintasi garis Isyarat. Tiada lagi keraguan dalam memasuki dagangan!
✅ Histogram Nada Berganda untuk Visualisasi Tren yang Lebih Baik – Bar histogram positif dan negatif dikodkan warna, membantu anda melihat dengan segera bila momentum berubah ke arah anda.
✅ Pilihan Harga Terpakai yang Fleksibel – Gunakan pengiraan MACD pada Harga Buka, Tinggi, Rendah, Tutup, Median, Tipikal, atau Berwajaran untuk menyesuaikan penunjuk mengikut gaya dagangan anda.
✅ Sesuai untuk Dagangan Harian & Swing – Direka untuk berfungsi pada Forex, Saham, Indeks, dan Kripto, sama ada anda scalping carta 1 minit atau berdagang pada jangka masa 4 jam.
✅ Integrasi Lancar dengan cTrader – Dioptimumkan sepenuhnya untuk cTrader dengan prestasi masa nyata dan kelewatan minimum, memberi anda kelebihan berbanding penunjuk MACD tradisional.
📈 Cara Menggunakan MACD Pro Trader untuk Dagangan Harian
Strategi: Persilangan MACD + Pengesahan Momentum
Strategi yang mudah tetapi berkuasa ini direka untuk menangkap pergerakan harga jangka pendek dan memaksimumkan keuntungan dalam pasaran yang sedang tren.
🔹 Langkah 1: Kenal Pasti Tren
- Gunakan Persilangan Garis MACD & Garis Isyarat sebagai pencetus pertama anda.
- Cari MACD melintasi di atas garis Isyarat untuk setup bullish.
- Cari MACD melintasi di bawah garis Isyarat untuk setup bearish.
🔹 Langkah 2: Sahkan dengan Histogram
- Sebuah histogram positif yang berkembang mengesahkan momentum bullish yang kuat.
- Sebuah histogram negatif yang berkembang mengesahkan momentum bearish yang kuat.
- Jika histogram lemah atau rata, tunggu isyarat yang lebih kuat.
🔹 Langkah 3: Masuk ke Dagangan
- Masuk Beli: Apabila MACD melintasi di atas garis Isyarat dan histogram bertukar hijau.
- Masuk Jual: Apabila MACD melintasi di bawah garis Isyarat dan histogram bertukar merah.
🔹 Langkah 4: Tetapkan Stop Loss & Ambil Untung
- Stop Loss: Letakkan stop loss anda tepat di bawah swing rendah terkini (untuk beli) atau di atas swing tinggi terkini (untuk jual).
- Ambil Untung: Sasarkan 2x stop loss anda untuk nisbah risiko-ganjaran yang kukuh (contohnya, risiko 10 pips untuk mendapat 20 pips).
🔹 Petua Bonus: Gunakan Jangka Masa Lebih Tinggi untuk Pengesahan
Sebelum memasuki dagangan, periksa jangka masa lebih tinggi (contohnya, 15m jika berdagang 5m) untuk mengesahkan arah tren. Jika kedua-dua jangka masa selari, dagangan anda mempunyai kebarangkalian kejayaan yang lebih tinggi!
🎯 Siapa MACD Pro Trader untuk?
✅ Pedagang Forex yang mencari isyarat MACD berketepatan tinggi.
✅ Scalpers & pedagang harian yang memerlukan titik masuk yang pantas dan boleh dipercayai.
✅ Pedagang Saham & Kripto yang ingin menunggang tren dengan keyakinan.
✅ Pedagang Swing yang ingin mengenal pasti peralihan momentum jangka panjang.
Jika anda penat terlepas dagangan hebat atau bergelut untuk mengatur masa masuk anda, MACD Pro Trader adalah penyelesaian yang anda tunggu-tunggu!
💎 Dapatkan MACD Pro Trader Hari Ini & Tingkatkan Dagangan Anda ke Tahap Seterusnya!
🔹 100% Dioptimumkan untuk cTrader – Tiada kelewatan, tiada cat semula, hanya isyarat bersih dan boleh digunakan.
🔹 Muat Turun Segera – Mulakan penggunaannya dalam beberapa minit!
🔹 Kemas Kini Sepanjang Hayat – Dapatkan semua penambahbaikan masa depan tanpa kos tambahan.
📥 Dapatkan salinan anda sekarang dan mula berdagang dengan lebih bijak! 🚀
Ringkasan
A dual-tone histogram visually represents momentum shifts with color-coded positive and negative bars, enhancing trend analysis. Users can apply MACD calculations to various price types including Open, High, Low, Close, Median, Typical, or Weighted prices to tailor the indicator to their trading style.
MACD Pro Trader is suitable for scalpers, day traders, swing traders, and those seeking to identify both short-term and long-term momentum changes. It is optimized for real-time performance with minimal lag on cTrader. The product includes a recommended trading strategy based on MACD line and Signal line crossovers confirmed by histogram momentum, with guidance on entry, stop loss, and take profit placement. Higher timeframe confirmation is suggested to improve trade probability. The indicator supports multiple timeframes from 1-minute scalping to 4-hour swing trading.
Ulasan pelanggan
5 | 60 % | |
4 | 40 % | |
3 | 0 % | |
2 | 0 % | |
1 | 0 % |
Perbincangan
Soalan Lazim





























Harga