

Penerangan
🧠 Penunjuk RSI Lanjutan – Analisis Momentum Tepat
Dapatkan Pemahaman Lebih Mendalam tentang Tren Pasaran dengan RSI yang Lebih Pintar
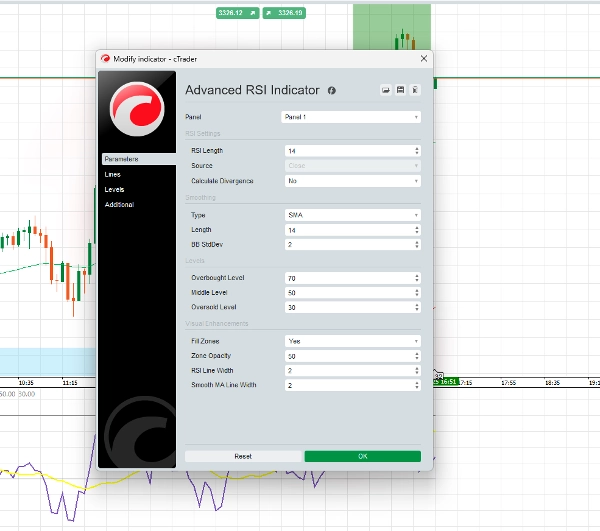
Penunjuk RSI Lanjutan adalah evolusi berkuasa alat RSI klasik, dibangunkan untuk pedagang yang menghargai ketepatan dan penapisan isyarat pintar. Dengan pelicinan algoritma lanjutan, zon adaptif, dan pengesanan divergensi terintegrasi, alat ini menyediakan analisis momentum yang diperhalusi untuk semua pasaran dan jangka masa.
🔍 Ciri-ciri Utama:
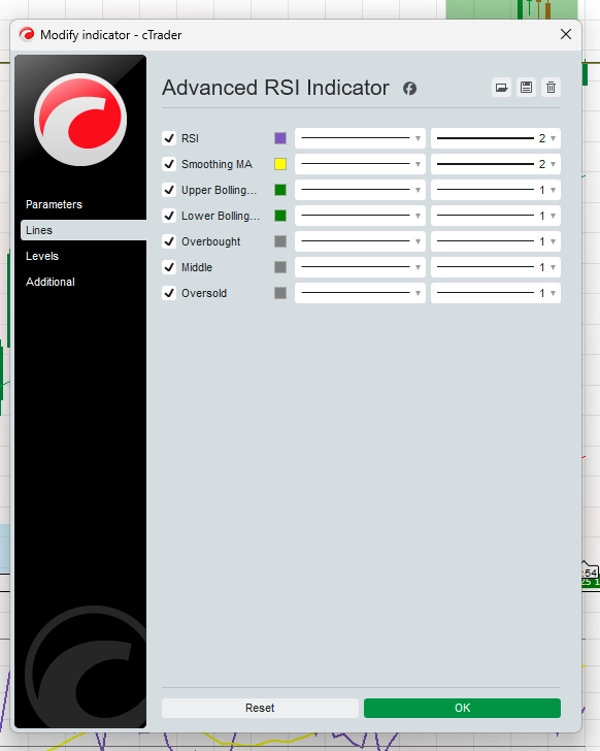
✅ Lengkung RSI Licin
Mengurangkan pergerakan bergelora dan isyarat palsu untuk pemahaman yang lebih jelas tentang tren pasaran.
✅ Zon Isyarat Adaptif
Melangkaui tahap tradisional 70/30 dengan ambang dinamik yang bertindak balas terhadap volatiliti pasaran.
✅ Zon Momentum Berkod Warna
Menilai dengan cepat momentum bullish atau bearish dengan reka bentuk visual yang intuitif.
✅ Amaran Divergensi
Menonjolkan persediaan divergensi bullish dan bearish untuk menyokong pembuatan keputusan strategik.
✅ Sistem Amaran Tersuai
Tetapkan amaran untuk lintasan tahap RSI dan isyarat divergensi supaya anda tidak terlepas saat penting.
✅ Multi-Aset, Multi-Jangka Masa
Dioptimumkan untuk digunakan merentasi forex, kripto, saham, indeks, dan lain-lain — dari carta M1 hingga harian.
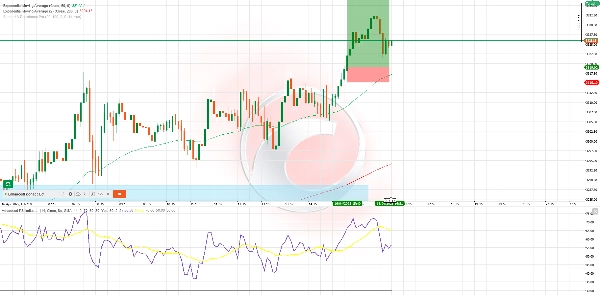
⚙️ Contoh Strategi – RSI Wave Ride
Terbaik untuk: Perdagangan ayunan H1 & H4
Penunjuk digunakan: RSI Lanjutan, 50 EMA, 200 EMA
Contoh Beli:
- Harga berada di atas 50 & 200 EMA
- RSI turun di bawah 40 dan mula naik
- Warna momentum bullish muncul
- (Pilihan) Divergensi bullish dikesan
- Masuk: Penutupan lilin di atas isyarat
- SL: Di bawah rendah ayunan terakhir
- TP: 1.5x–2x risiko atau rintangan terkini
Contoh Jual:
- Harga berada di bawah 50 & 200 EMA
- RSI bergerak di atas 60, kemudian mula menurun
- Warna momentum bearish mengesahkan arah
- (Pilihan) Divergensi bearish menambah kekuatan
- Masuk: Penutupan lilin pengesahan
- SL: Di atas tinggi ayunan terakhir
- TP: 1.5x–2x risiko atau sokongan terkini
💬 Mengapa Pedagang Memilih Alat Ini:
- Mesra pengguna, tetapi berkuasa
- Isyarat tidak dicat semula
- Diuji merentasi pasaran utama
- Boleh digunakan secara berdiri sendiri atau bersama strategi lain
Ringkasan
Ulasan pelanggan
5 | 100 % | |
4 | 0 % | |
3 | 0 % | |
2 | 0 % | |
1 | 0 % |


