Mô tả
Kênh hồi quy thống kê với các mức Fibonacci trên nhiều loại tính toán, khung thời gian và phạm vi ngày.
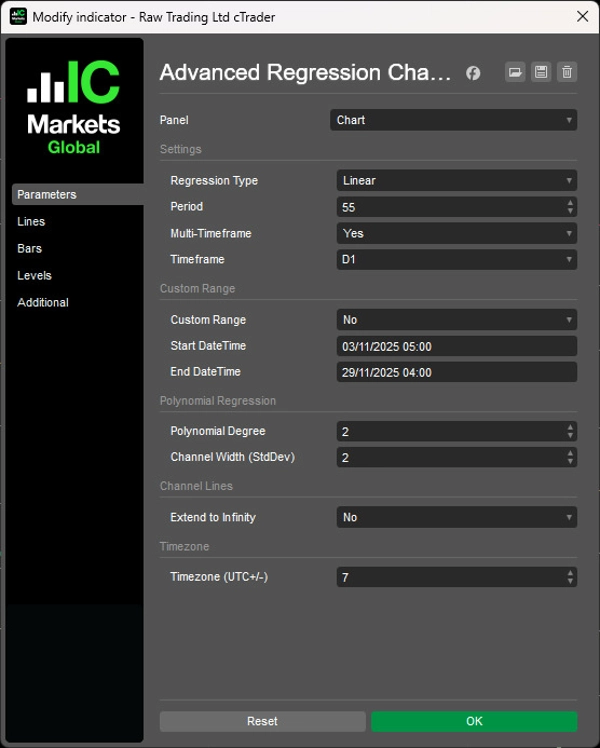
Phù hợp các đường hồi quy qua dữ liệu giá bằng tám phương pháp (Tuyến tính, Logarit, Mũ, Trọng số, Đa thức, Trung bình động, Trung bình động mũ, LOWESS) với các dải độ lệch chuẩn để phân tích hồi quy về trung bình.
Chín mức kênh Fibonacci (0% đến 100%), phân tích đa khung thời gian trên 16 khoảng thời gian với hiển thị nội suy, ba chế độ tính toán (Dựa trên kỳ, Phạm vi ngày, MTF), điều khiển bậc đa thức (1-5) cho cấu trúc xu hướng cong, hệ số nhân độ lệch chuẩn để điều chỉnh độ rộng kênh, phân tích thời gian có nhận biết múi giờ cho phân tích sự kiện, mở rộng đường xu hướng vô hạn, và bộ nhớ đệm LRU tối ưu cung cấp phân tích hồi quy thống kê toàn diện cho nhà giao dịch nhắm vào các vùng hồi quy về trung bình và cấu trúc giá cong trong các điều kiện thị trường.
TÍNH NĂNG
8 Loại Tính Toán Hồi Quy
- Tuyến tính: Hồi quy tuyến tính bình phương tối thiểu cổ điển
- Logarit: Hồi quy dựa trên log tự nhiên cho các chuyển động giá mũ
- Mũ: Phù hợp đường cong mũ cho các xu hướng tăng tốc
- Trọng số: Hồi quy tuyến tính với các thanh gần đây được trọng số cao hơn
- Đa thức: Phù hợp cong (bậc 1-5) cho các xu hướng phi tuyến
- Trung bình động: Hồi quy dựa trên trung bình động
- Trung bình động mũ: Hồi quy dựa trên EMA để làm mượt xu hướng
- LOWESS: Hồi quy trọng số cục bộ để làm mượt thích ứng
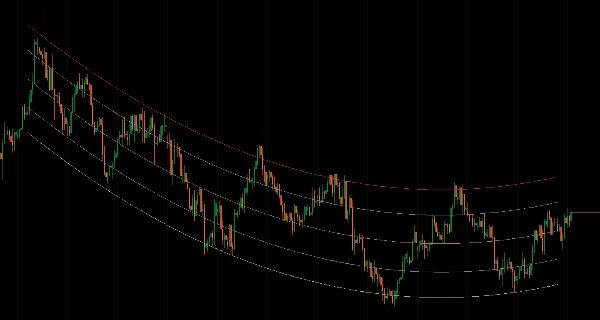
9 Mức Kênh Fibonacci
- Phạm vi kênh đầy đủ: 100% (trên), 88.6%, 76.4%, 61.8%, 50% (đường giữa), 38.2%, 23.6%, 11.4%, 0% (dưới)
- Vùng hồi quy về trung bình trong các dải hồi quy
- Điểm tham chiếu hỗ trợ/kháng cự chính xác
- Kiểm soát màu sắc/phong cách/độ dày độc lập cho mỗi mức
Phân Tích Đa Khung Thời Gian
- Tính toán hồi quy trên khung thời gian cao hơn, hiển thị trên biểu đồ hiện tại
- 16 khung thời gian có sẵn (m1 đến Hàng tháng)
- Giá trị kênh nội suy để hiển thị mượt mà qua các thanh biểu đồ
- Cấu trúc khung thời gian cao hơn mà không cần chuyển đổi biểu đồ
3 Chế Độ Tính Toán
- Dựa trên kỳ: Cửa sổ lăn của N thanh (mặc định)
- Phạm vi ngày: Ngày bắt đầu/kết thúc tùy chỉnh cho các sự kiện hoặc giai đoạn cụ thể với phân tích thời gian có nhận biết múi giờ (bù UTC+/-)
Tùy Chọn Hiển Thị Kênh
- Đầu ra tiêu chuẩn: Vẽ tất cả 9 mức dưới dạng các đường chỉ báo
- Mở rộng vô hạn: Hiển thị dưới dạng các đường xu hướng chiếu về phía trước vô thời hạn
- Tự động làm mới khi màu sắc/phong cách thay đổi
- Hiển thị sạch sẽ—không có giá trị dư thừa ngoài cửa sổ tính toán
Chế Độ Phạm Vi Ngày
- Xác định ngày bắt đầu/kết thúc chính xác (định dạng dd/MM/yyyy HH:mm)
- Phân tích các sự kiện, giai đoạn hoặc cấu trúc thị trường cụ thể
- Độc lập với tham số kỳ
- Chuyển đổi múi giờ từ giờ địa phương người dùng sang giờ máy chủ
Tính Toán Động
- Cập nhật thời gian thực khi các thanh mới hình thành
- Bộ nhớ đệm LRU tối ưu với theo dõi phạm vi dữ liệu bẩn
- Kích thước bộ nhớ đệm thích ứng dựa trên khung thời gian
- Tìm kiếm nhị phân để tra cứu phạm vi ngày nhanh
Kiểm Soát Độ Rộng Kênh
- Hệ số nhân độ lệch chuẩn (mặc định 2.0)
- Dải rộng hơn cho sự mở rộng biến động
- Dải hẹp hơn cho thị trường giới hạn phạm vi
- Đồng nhất trên tất cả các loại hồi quy
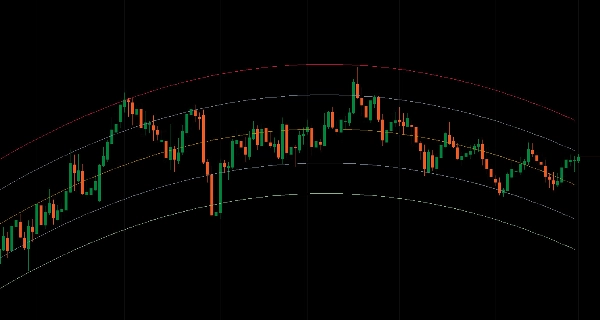
Hồi Quy Đa Thức
- Điều khiển bậc: 1-5 (cao hơn = cong hơn)
- Bắt được các xu hướng phi tuyến
- Hữu ích cho cấu trúc giá parabol hoặc cong
- Quay về hồi quy tuyến tính khi bậc = 1
Quản Lý Hiển Thị Sạch Sẽ
- Không tính toán trên thanh đang hình thành—chỉ trên các thanh đã hoàn thành
- Cắt ngắn đa khung thời gian đúng cách—đường kết thúc tại thanh HTF cuối cùng đã hoàn thành
- Ngoại suy dựa trên độ dốc để chiếu hướng nhất quán
- Chuỗi đầu ra rõ ràng với tên mức mô tả
__________________________________________________________________________________________
THÊM CÁC CHỈ BÁO MIỄN PHÍ
Khám phá một loạt các công cụ phân tích thị trường—từ cấu trúc và khối lượng đến hồi quy, biến động và khung thời gian tùy chỉnh.
Mã nguồn có sẵn trên kho GitHub.
Tất cả đều miễn phí sử dụng. Nhưng nếu bạn muốn hỗ trợ cà phê, bạn có thể gửi tại đây.
Hỗ Trợ/Kháng Cự
Khối Lượng
- Trình Phân Tích Hoạt Động Khối Lượng
- Phân Tích Hiệu Quả Khối Lượng
- Phân Tích Hồ Sơ Khối Lượng
- Hồ Sơ Khối Lượng - Cập Nhật
- Phân Tích Phân Tán Khối Lượng
- VWAP (Giá Trung Bình Trọng Số Khối Lượng)
Trung Bình Động
- Kênh SSL
- Trung Bình Động Neo
- Trung Bình Động Tỷ Lệ Độ Lệch
- Bộ Kích Hoạt Cao Thấp Gann
- Đường Xu Hướng Tức Thời
- MA Thích Ứng Kaufman với Tầm Nhìn Xu Hướng
- Kênh Trung Bình Động
- Bộ Trung Bình Động
- Kênh Trung Bình Động Xu Hướng
Tiện Ích/Tùy Chỉnh
Dựa Trên Hồi Quy
Biến Động
Bộ Dao Động
__________________________________________________________________________________________
TỪ CHỐI TRÁCH NHIỆM
Giao dịch có rủi ro. Chỉ báo này chỉ dành cho phân tích kỹ thuật — luôn áp dụng quản lý rủi ro phù hợp và giao dịch có trách nhiệm.
PHẢN HỒI & CẢI TIẾN
Nếu bạn có đề xuất, yêu cầu tính năng hoặc ý tưởng cải tiến, vui lòng để lại bình luận trong tab Thảo luận. Phản hồi của bạn giúp cải thiện chỉ báo cho mọi người.
Tóm tắt
It offers multi-timeframe analysis across 16 periods (from 1 minute to monthly), enabling regression calculations on higher timeframes displayed on the current chart with smooth interpolated rendering. Users can select among three calculation modes: Period-Based (rolling window), Date Range (custom start/end with timezone-aware parsing), and Multi-Timeframe. Channel width is adjustable via a standard deviation multiplier to reflect market volatility.
The indicator features real-time dynamic updates, optimized caching for performance, and extend-to-infinity trendline projections for forward-looking analysis. Visual output is clean, with slope-based extrapolation and no calculations on forming bars. This tool is designed for traders analyzing mean reversion and complex price structures across various market conditions.