
Descrição
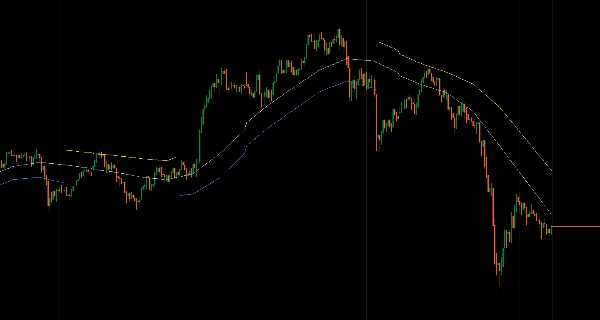
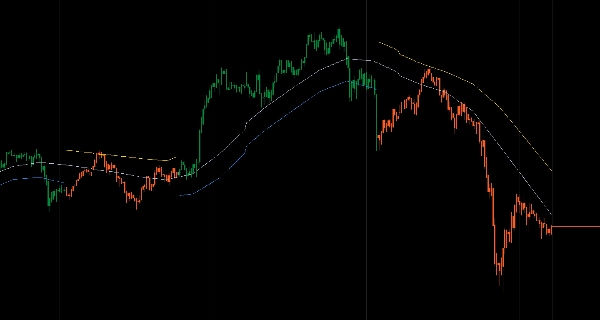
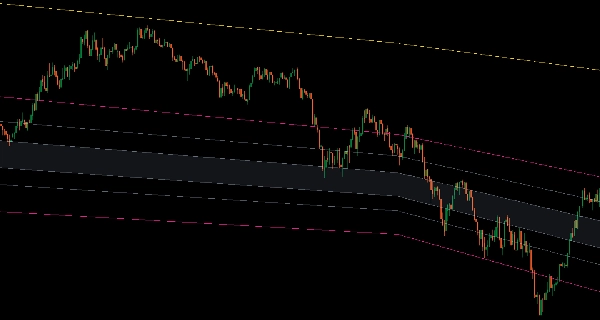
Sistema de canal adaptativo de três cores usando médias móveis em todos os quatro preços OHLC para análise da direção e estrutura da tendência.
Exibe limites High/Low, linhas de viés direcional Open/Close e equilíbrio mediano com estados de tendência codificados por cores (Azul para tendência de alta, Dourado para tendência de baixa, Cinza para neutro) que se adaptam juntos.
Dois modos de exibição (canal completo ou redução de ruído baseada na tendência), seis zonas Fibonacci opcionais (retracements de canal completo, níveis de meio canal, extensões de breakout), 15 algoritmos de médias móveis (Arnaud Legoux, Jurik, Hull, KAMA, VIDYA, Deviation Scaled, SuperSmoother, Ultimate Smoother, McGinley Dynamic, T3, ZLEMA, Laguerre), interpolação multitemporal, cálculo de data âncora para períodos crescentes baseados em eventos, e coloração de barras baseada na tendência fornecem uma estrutura de canal coesa para traders que buscam pullbacks e reversão à média dentro de limites definidos.
RECURSOS
Sistema de Tendência Três Cores
- Linhas azuis: Tendência de alta confirmada—negocie pullbacks para a linha inferior
- Linhas douradas: Tendência de baixa confirmada—negocie rebotes para a linha superior
- Linhas cinzas: Neutro/faixa—evite extremos, faça scalp no meio
- Todas as linhas se adaptam juntas—sem sinais mistos
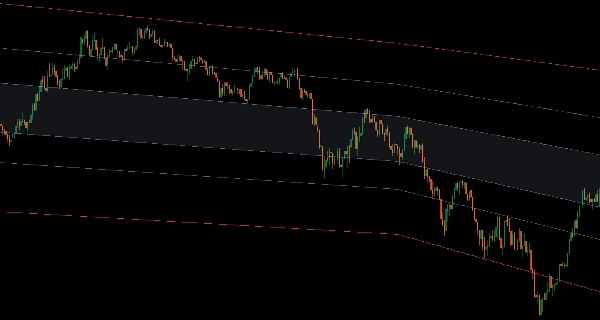
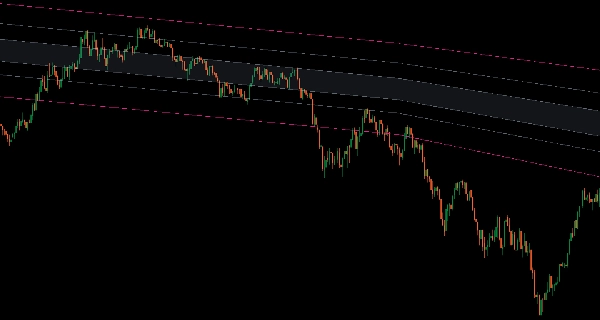
Estrutura Completa do Canal
- Linhas High/Low definem os limites do canal
- Linhas Open/Close mostram o viés direcional dentro do canal
- Linha mediana (centro dos quatro) marca o verdadeiro equilíbrio
- Estrutura integrada que se move de forma coesa
Dois Modos de Exibição
- Modo Canal: Sempre mostrar ambos os limites com cores da tendência
- Modo Baseado na Tendência: Ocultar linha superior em tendências de alta, linha inferior em tendências de baixa—reduz a confusão visual, mantém o foco no limite negociável
6 Zonas Fibonacci (Opcional)
- Entre Low-High (retracements de canal completo)
- Entre Low-Median ou Median-High (níveis de meio canal)
- Extensões superior/inferior (alvos de breakout)
- Intervalo total (da extensão inferior à superior)
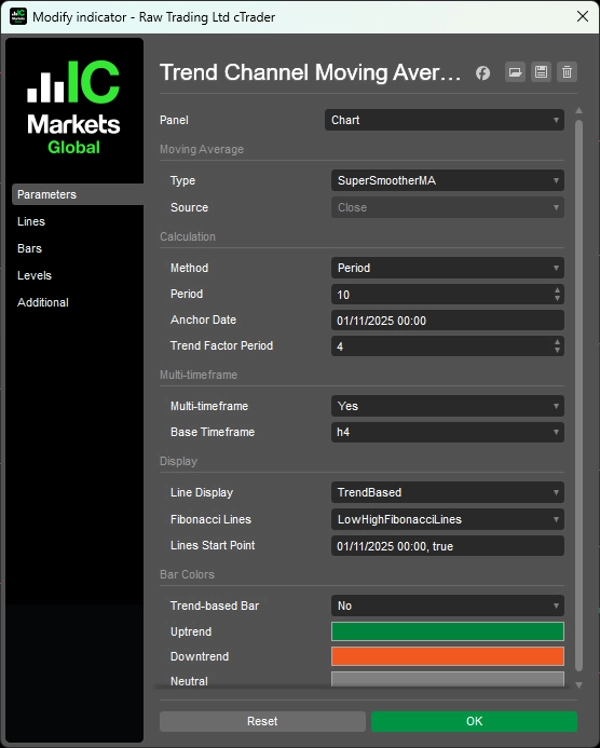
15 Tipos de Médias Móveis
- Algoritmos profissionais: Arnaud Legoux, Jurik, Hull, KAMA, VIDYA, Deviation Scaled, SuperSmoother, Ultimate Smoother, McGinley Dynamic, T3, ZLEMA, Laguerre
- Sinais limpos otimizados para identificação de tendências
Funcionalidade Avançada
- Modo multitemporal com interpolação suave
- Cálculo de data âncora (período crescente a partir de evento/nível específico)
- Coloração de barras baseada na tendência (opcional)
- Controle do ponto inicial das linhas (ocultar dados históricos, mostrar apenas estrutura recente)
__________________________________________________________________________________________
MAIS INDICADORES GRATUITOS
Explore uma ampla gama de ferramentas de análise de mercado—desde estrutura e volume até regressão, volatilidade e intervalos de tempo personalizados.
O código-fonte está disponível no repositório GitHub.
Todos gratuitos para uso. Mas se quiser enviar um suporte para café, você pode fazê-lo aqui.
Suporte/Resistência
Volume
- Volume Activity Profiler
- Volume Efficiency Analyzer
- Volume Profile Analytics
- Volume Profile - Updated
- Volume Spread Analysis
- VWAP (Preço Médio Ponderado por Volume)
Médias Móveis
- SSL Channel
- Média Móvel Ancorada
- Média Móvel Deviation-Scaled
- Gann High Low Activator
- Linha de Tendência Instantânea
- Kaufman Adaptive MA com Trend Vision
- Canal de Média Móvel
- Suite de Médias Móveis
- Média Móvel do Canal de Tendência
Utilitários/Personalizados
- Ferramentas de Gráfico
- Intervalos de Tempo Personalizados
- Candlestick de Intervalo de Tempo Superior
Baseado em Regressão
Volatilidade
Osciladores
__________________________________________________________________________________________
AVISO LEGAL
Negociar envolve riscos. Este indicador destina-se apenas à análise técnica — sempre aplique uma gestão de risco adequada e negocie com responsabilidade.
FEEDBACK E MELHORIAS
Se você tiver sugestões, pedidos de recursos ou ideias para melhorias, por favor deixe um comentário na aba Discussão. Seu feedback ajuda a melhorar o indicador para todos.
Resumo
Key features include two display modes—full channel and trend-based clutter reduction—and six optional Fibonacci zones covering full and half-channel retracements plus breakout extensions. The system supports 15 professional moving average algorithms such as Arnaud Legoux, Jurik, Hull, KAMA, VIDYA, and others, optimized for clean trend identification. Additional functionalities include multi-timeframe interpolation, anchor date calculation for event-based periods, trend-based bar coloring, and control over line start points to focus on recent data.
This indicator is designed to help traders identify pullbacks and mean reversion opportunities within defined channel boundaries, enhancing decision-making in various market conditions.
Avaliações de clientes
5 | 100 % | |
4 | 0 % | |
3 | 0 % | |
2 | 0 % | |
1 | 0 % |


