
Descrição
NOTAS IMPORTANTES - LEIA PRIMEIRO
O Volume no Forex Não é Volume Real
O volume no forex é volume de ticks — conta quantas vezes o preço muda. NÃO conta quanto dinheiro foi negociado.
O Que o Volume de Tick Não Pode Mostrar
- Tamanho da negociação. Uma negociação de $100 e uma de $10.000.000 contam ambas como 1 tick.
- Fluxo real de dinheiro. Você não pode ver se dinheiro grande ou pequeno moveu o preço.
- Liquidez verdadeira. Você não pode ver quantas ordens estão esperando no mercado.
- Atividade bancária. Bancos veem dados de volume real. Você não.
O Que Isso Significa
O volume de tick mostra apenas com que frequência o preço mudou — não o dinheiro por trás disso. Isso cria problemas:
- Você não pode rastrear bancos ou instituições. Eles usam dados de volume real aos quais você não tem acesso.
- Você não pode provar teorias de "dinheiro inteligente". Essas ideias precisam de volume real, não contagem de ticks.
- Você não pode julgar a liquidez verdadeira. A atividade de ticks não mostra profundidade de ordens ou força real do mercado.
- Você não pode medir o poder real de compra ou venda. Muitas negociações pequenas parecem iguais a uma grande negociação institucional.
- Picos de volume podem enganar. Um pico pode ser apenas ruído algorítmico, não interesse real de negociação.
Como Usar Este Indicador Corretamente
- Trate-o como um medidor de atividade, não de dinheiro. Volume de tick alto = mercado está movimentado. Volume de tick baixo = mercado está calmo. Nada mais.
- Compare a atividade entre diferentes horários. Use para ver: A sessão de Londres está mais movimentada que a de Nova York? Hoje está mais ativo que ontem? O período de tendência está mais movimentado que a consolidação?
- Combine com a estrutura de preço. Use suporte/resistência, pontos de oscilação ou BOS/ChoCH junto com volume. O contexto do preço previne sinais falsos de picos de volume ruidosos.
- Observe a atividade em níveis importantes de preço. Quando o preço testa um nível chave e o volume de tick aumenta, significa que mais traders estão ativos. NÃO significa que grandes players estão envolvidos.
- Não presuma que mostra atividade institucional. Volume de tick não pode mostrar acumulação, grandes ordens ou "dinheiro inteligente". Use apenas para medir ritmo e tempo.
__________________________________________________________________________________________
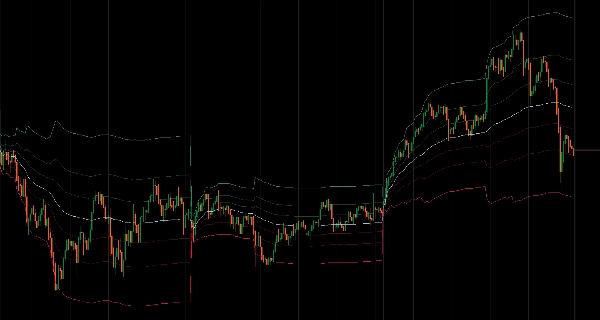
Preço Médio Ponderado por Volume com períodos de reinício flexíveis e três métodos de cálculo de bandas.
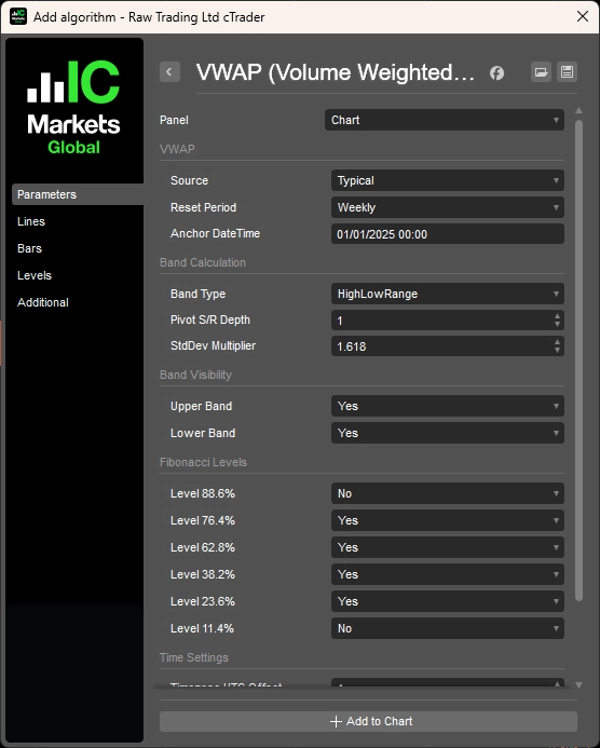
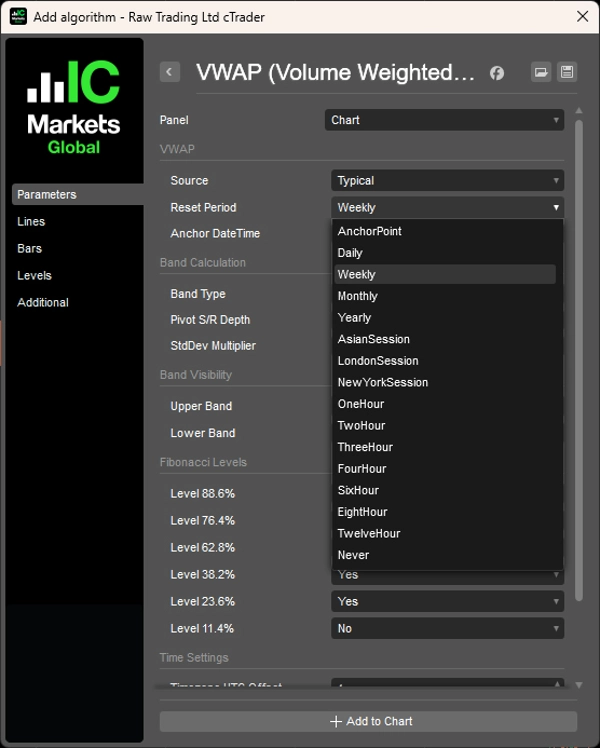
Calcula o Preço Médio Ponderado por Volume com períodos de reinício flexíveis incluindo intervalos baseados em tempo (diário, semanal, mensal, anual ou horário personalizado), reinícios baseados em sessões (Ásia, Londres, Nova York com horários de início configuráveis), modo ponto âncora para fixar o VWAP em eventos específicos, ou cálculo contínuo a partir de todos os dados disponíveis.
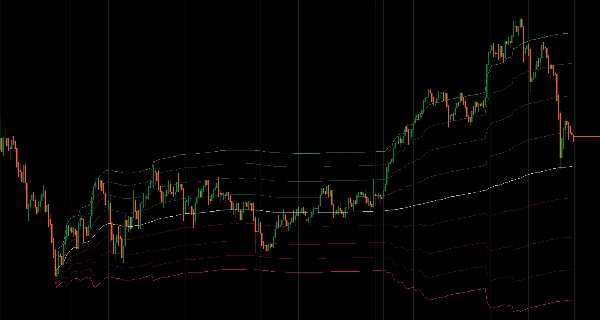
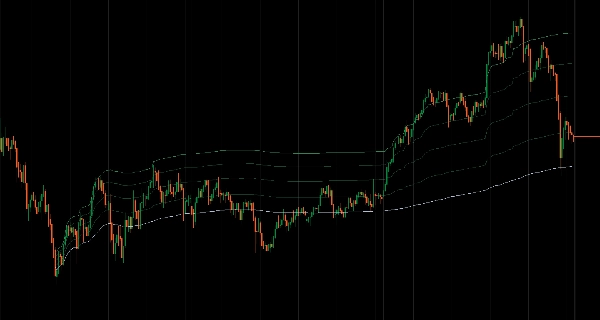
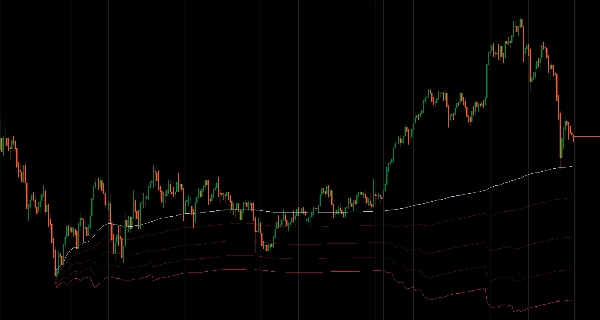
Oferece três métodos de cálculo de bandas: Alcance Alto/Baixo baseado no intervalo de preço do período anterior, Pivot Fibonacci usando cálculos clássicos de pivô, e bandas de Desvio Padrão que se expandem e contraem com a volatilidade.
Você pode personalizar oito níveis de Fibonacci (100%, 88,6%, 76,4%, 62,8%, 50%, 38,2%, 23,6%, 11,4%, 0%) com alternância individual de visibilidade e controles rápidos de grupos de bandas superior/inferior. O gerenciamento de sessões inclui configuração exata do horário de início com ajuste de deslocamento UTC e manipulação de reinício horário sensível ao fuso horário.
RECURSOS
- Períodos de Reinício Flexíveis
-
- Baseado em tempo: Diários, Semanais, Mensais, Anuais ou intervalos horários personalizados (1H, 2H, 3H, 4H, 6H, 8H, 12H)
- Baseado em sessão: Sessões Ásia, Londres, Nova York com horários de início configuráveis e deslocamentos de fuso horário
- Ponto Âncora: Fixar VWAP em qualquer data/hora específica para análise orientada a eventos
- Contínuo: Calcular a partir de todos os dados disponíveis sem reinício
- Três Métodos de Cálculo de Bandas
-
- Alcance Alto/Baixo: Bandas baseadas no intervalo de preço do período anterior
- Pivot Fibonacci: Cálculo clássico de ponto pivô a partir do H/L/C do período anterior
- Desvio Padrão: Bandas estatísticas tradicionais que se expandem/contraem com a volatilidade
- Controle Completo dos Níveis de Fibonacci
-
- 8 níveis personalizáveis: 100%, 88,6%, 76,4%, 62,8%, 50% (VWAP), 38,2%, 23,6%, 11,4%, 0%
- Alternância individual de visibilidade dos níveis
- Controles de grupo para bandas superior/inferior para ajuste rápido
- Gerenciamento de Sessão
-
- Configure horários exatos de início de sessão com ajuste de deslocamento UTC (-12 a +14 horas)
- Exibição visual de informações da sessão mostra o cronograma atual de reinício
- Manipulação de reinício horário sensível ao fuso horário
- Otimizado para Desempenho
-
- Cálculo preguiçoso—bandas só são calculadas quando visíveis
- Cache inteligente e processamento em lote
- Impacto mínimo na CPU mesmo com todos os níveis ativados
__________________________________________________________________________________________
MAIS INDICADORES GRATUITOS
Explore uma ampla gama de ferramentas de análise de mercado — desde estrutura e volume até regressão, volatilidade e intervalos de tempo personalizados.
O código-fonte está disponível no repositório do GitHub repository.
Todos gratuitos para usar. Mas se quiser enviar um suporte para café, você pode fazer isso aqui.
Suporte/Resistência
Volume
- Perfilador de Atividade de Volume
- Analisador de Eficiência de Volume
- Análise de Perfil de Volume
- Perfil de Volume - Atualizado
- Análise de Spread de Volume
- VWAP (Preço Médio Ponderado por Volume)
Médias Móveis
- Canal SSL
- Média Móvel Ancorada
- Média Móvel Escalada por Desvio
- Ativador Gann High Low
- Linha de Tendência Instantânea
- Média Móvel Adaptativa Kaufman com Visão de Tendência
- Canal de Média Móvel
- Conjunto de Médias Móveis
- Média Móvel de Canal de Tendência
Utilitários/Personalizados
- Ferramentas de Gráfico
- Intervalos de Tempo Personalizados
- Candlestick de Intervalo de Tempo Superior
Baseado em Regressão
Volatilidade
Osciladores
__________________________________________________________________________________________
ISENÇÃO DE RESPONSABILIDADE
Negociar envolve riscos. Este indicador destina-se apenas à análise técnica — sempre aplique gerenciamento adequado de risco e negocie com responsabilidade.
FEEDBACK E MELHORIAS
Se você tiver sugestões, pedidos de recursos ou ideias para melhorias, por favor deixe um comentário na aba Discussão. Seu feedback ajuda a melhorar o indicador para todos.
Resumo
The indicator offers three band calculation methods: High/Low Range bands based on the previous period's price range, Fibonacci Pivot bands using classical pivot calculations, and Standard Deviation bands that adjust with market volatility. Users can customize eight Fibonacci levels (ranging from 0% to 100%) with individual visibility toggles and group controls for upper and lower bands.
Session management features include precise start time configuration with UTC offset adjustments and timezone-aware hourly resets, along with visual session information display. Performance optimizations include lazy calculation of bands only when visible, intelligent caching, and batch processing to minimize CPU usage.
Note: For forex markets, volume data represents tick volume (price change counts) rather than actual traded volume, so this indicator should be used as a measure of market activity rather than real money flow. It is intended for technical analysis with proper risk management.
Avaliações de clientes
5 | 100 % | |
4 | 0 % | |
3 | 0 % | |
2 | 0 % | |
1 | 0 % |


